

Ecommerce retention is as important as ever with high acquisition costs, economic woes, and increases in brand competition. As the cost of digital advertising continues to go up, retention marketing is beginning to expand throughout the marketing industry.
In order to maximize your retention efforts, you need to understand how to track and measure some key retention metrics. Once you know how to calculate them, you can begin to put them to work in your own store for lasting, profitable results. Here are 11 key retention metrics ecommerce marketers should be aware of.
At the root of any retention strategy is the desire to bring customers back. Whether they’ve only made one purchase or they’ve made five, retention marketing helps you bring every single customer back to make that next purchase. The following three retention metrics target repeat purchase behavior.
1. Customer Churn Rate (CCR)
Why is Customer Churn Rate important?
Knowing your churn rate helps you determine what steps to take when developing a retention strategy. Since you want this metric to be extremely low it stands to reason that the lower it is, the more effective your retention strategy is!
How do you calculate Customer Churn Rate?
To calculate your customer churn rate, you need to determine a timeframe in which to measure it. It’s a good idea to assess your customer churn rate on a semi-regular basis in order to keep your finger on the pulse of how your customers are responding to your retention marketing efforts. With that in mind, we’d recommend measuring this metric on a month-to-month basis.
Now that you have your date range, you can get to calculating! The formula for customer churn rate is as follows:
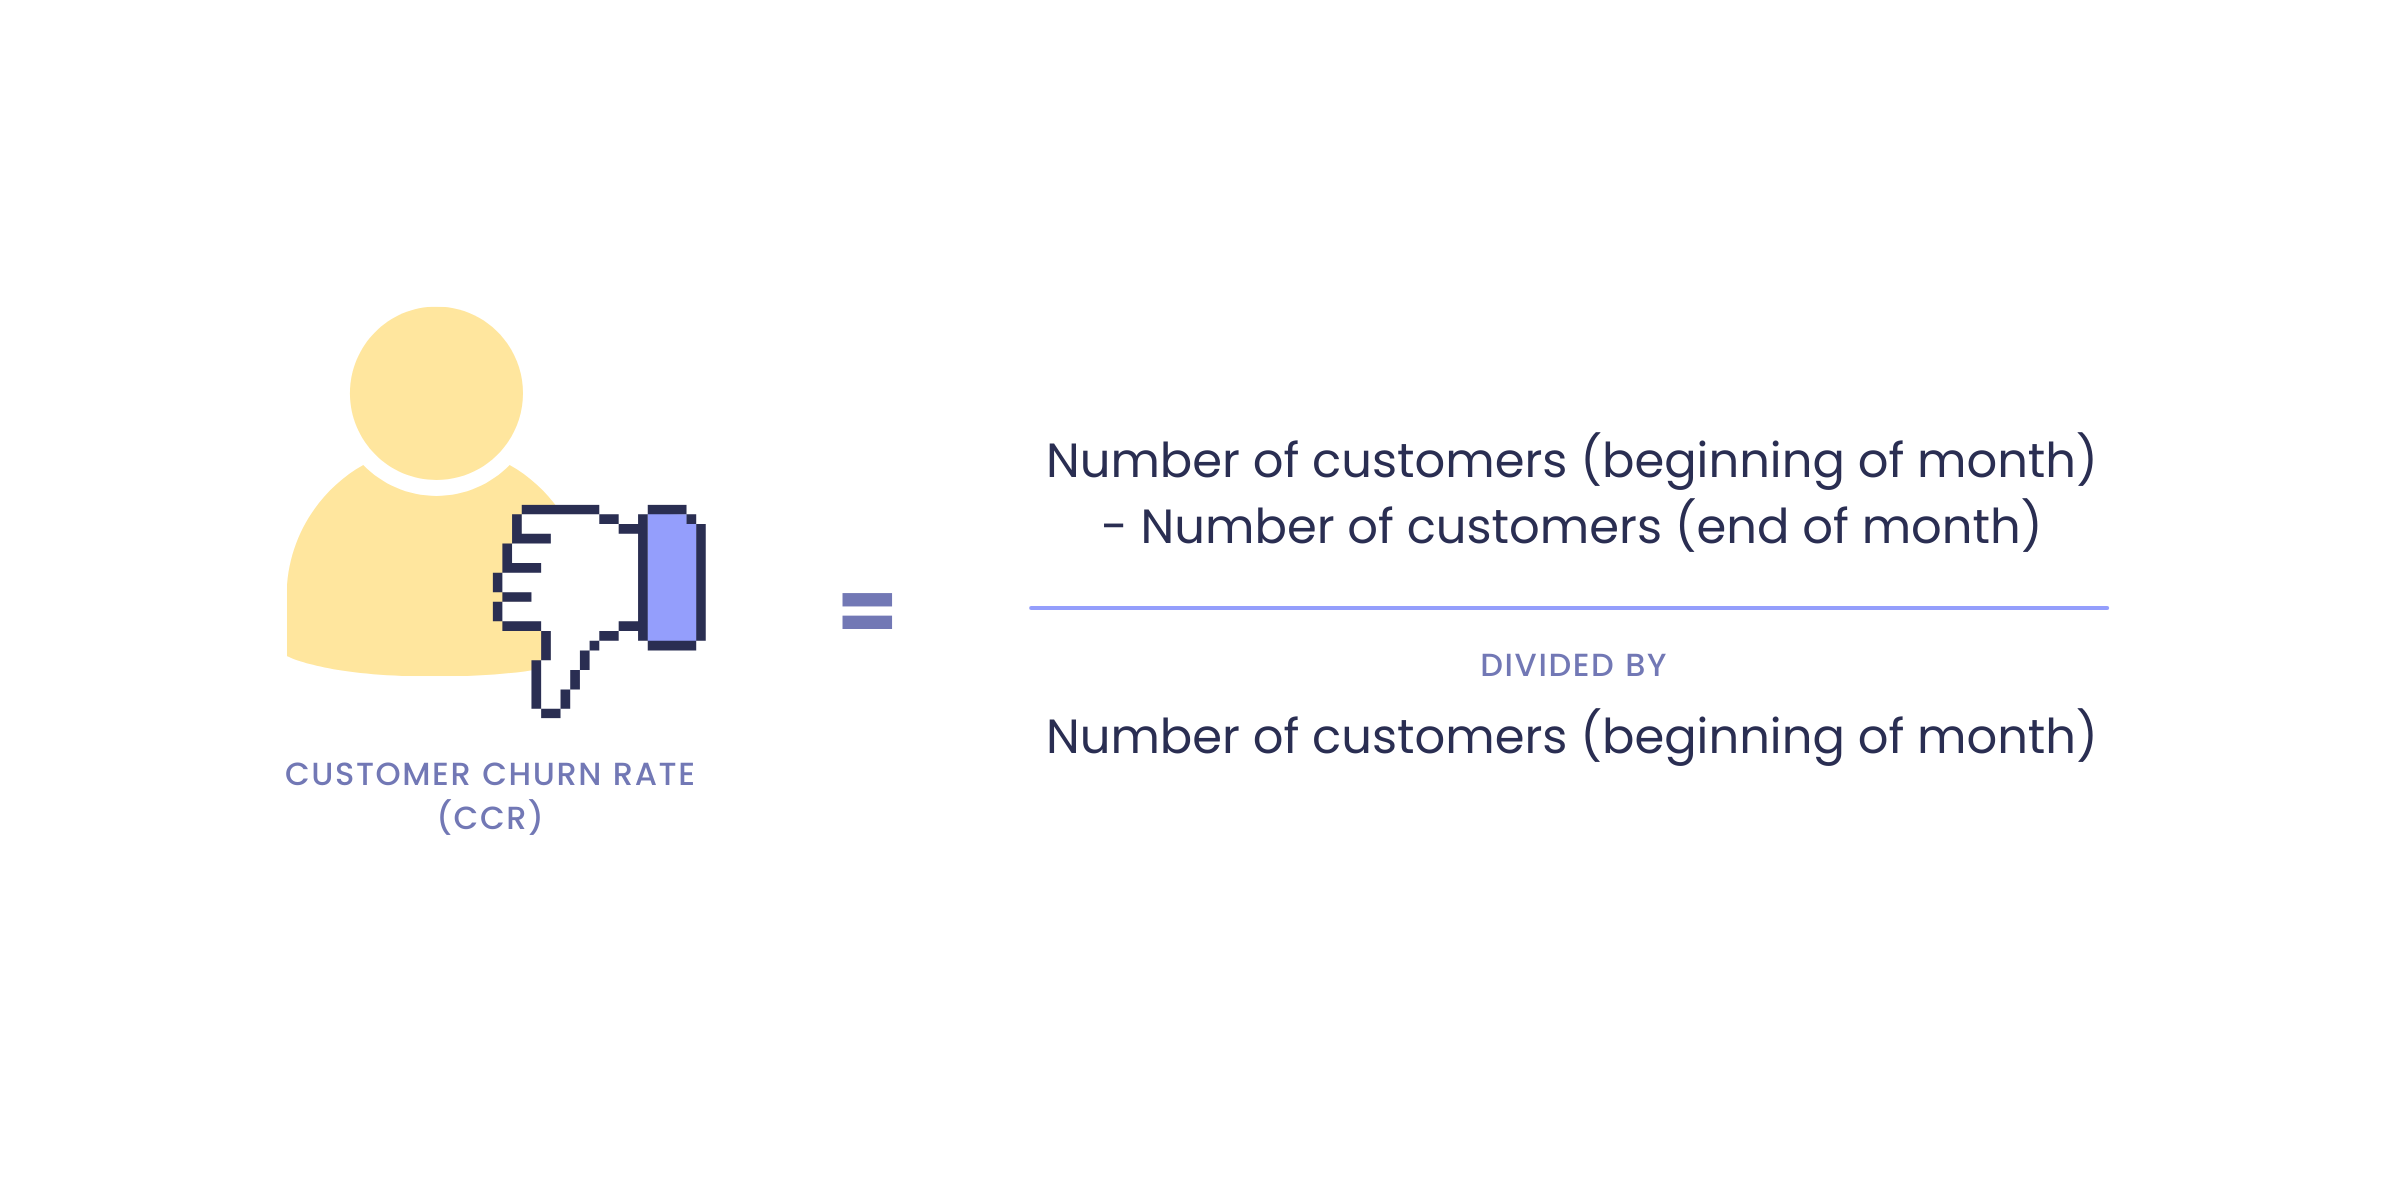
By determining how many customers you lost and dividing it by how many customers you had, you’re able to see what percentage of shoppers are choosing not to come back every month.
Improve your Customer Churn Rate with outstanding customer experience
The key to improving your customer churn rate is to provide an outstanding customer experience. It’s estimated that 61% of consumers say they will switch to a competitor after one bad customer experience. This means you need to bring your A-game to every transaction.
 Jonathan Roque
Our hot take is to implement a customer-centric loyalty program. By providing your customers with valuable incentives to stay, you create a switching cost that can’t be ignored.
2. Repeat Purchase Probability (RPP)
Why is Repeat Purchase Probability important?
Your brand’s repeat purchase probability rate is very closely related to your customer churn rate—the less likely they are to make another purchase, the more likely they are to churn. Keeping an eye on this metric allows you to assess where customers are falling off throughout the customer journey, giving you the opportunity to put preventative measures in place.
How do you calculate Repeat Purchase Probability?
Calculating your store’s repeat purchase probability is a little bit trickier than customer churn rate because it needs to be done in stages. This makes sense when you look at the formula:
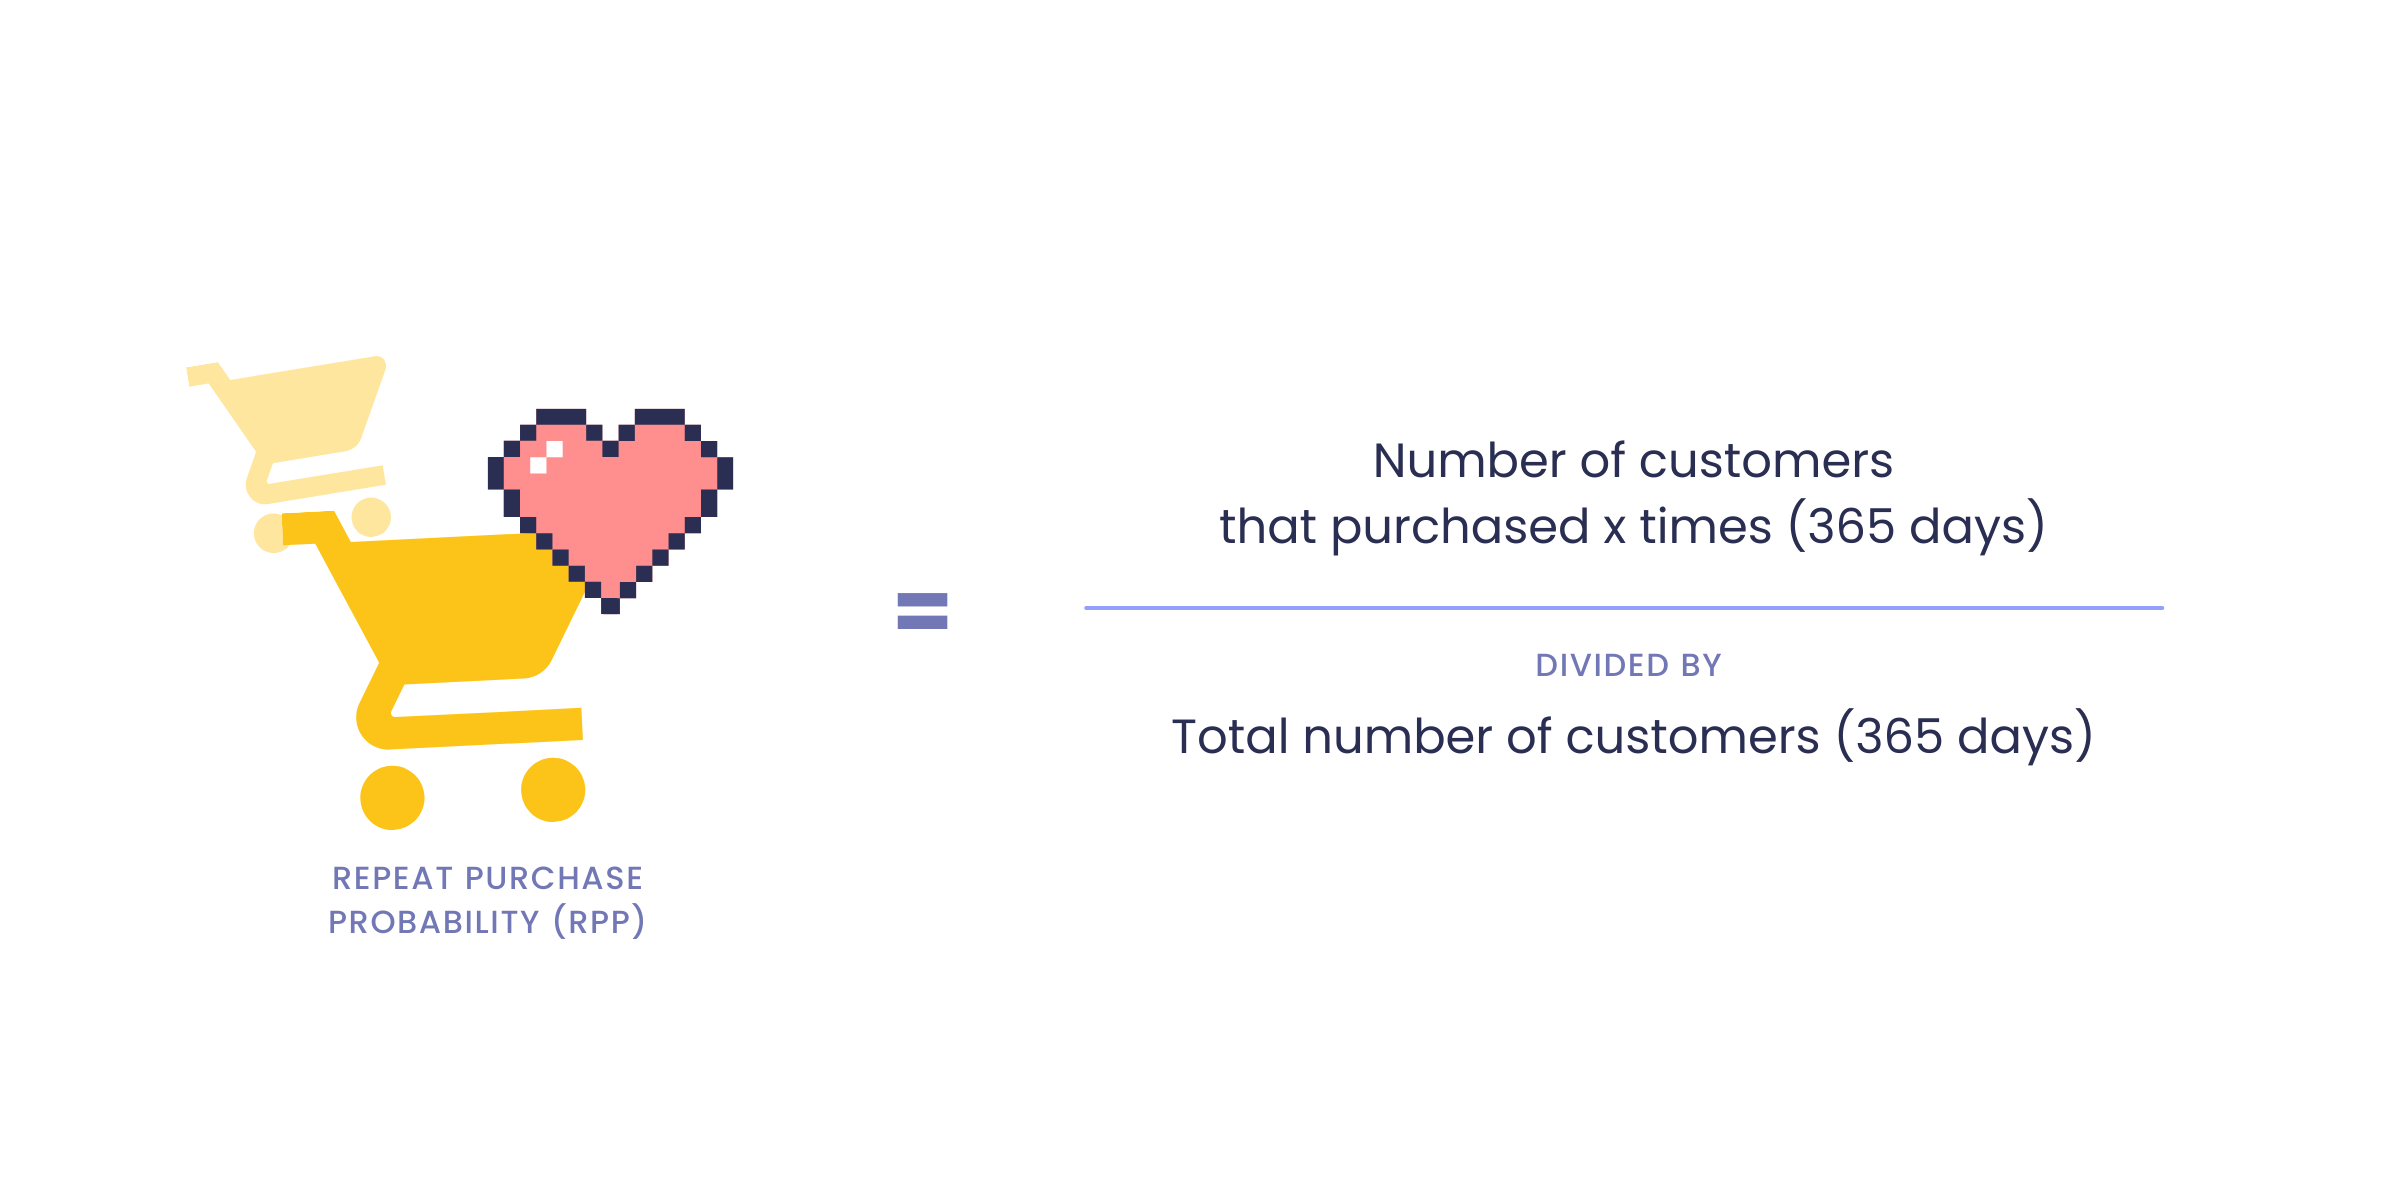
As you can see, you need to determine the number of purchases to use. In order to be most impactful, we recommend calculating your repeat purchase probability rate with different numbers of purchases to get a better read of your customer’s journey from beginning to end.
With this formula, you can pinpoint the exact moment that customers begin to fall out with your brand and launch a retention strategy to get them back on track.
Improve your Repeat Purchase Probability with gamification

If you want customers to come back, you need to give them a reason to come back. Adding an element of gamification to your customer loyalty program will show customers why your brand is valuable and how much they stand to gain by returning. Vasanti allows customers to earn reward points by engaging on the brand's Facebook and Instagram profiles, while also rewarding customers for product reviews.
3. Repeat Purchase Rate (RPR)
Why is Repeat Purchase Rate important?
Repeat customers are profitable for an ecommerce brand. Based on our data, 41% of an ecommerce store’s revenue is created by only 8% of its customers, and 35% is generated by your top 5% of customers. This 5% is made up of your most loyal repeat customers. This staggering reality is what makes your store’s repeat purchase rate so valuable. Your repeat purchase rate gives you a clearer snapshot of the effectiveness of your entire retention strategy, providing proof that each of your tactics is working.
Gabrielle Policella
How do you calculate Repeat Purchase Rate?
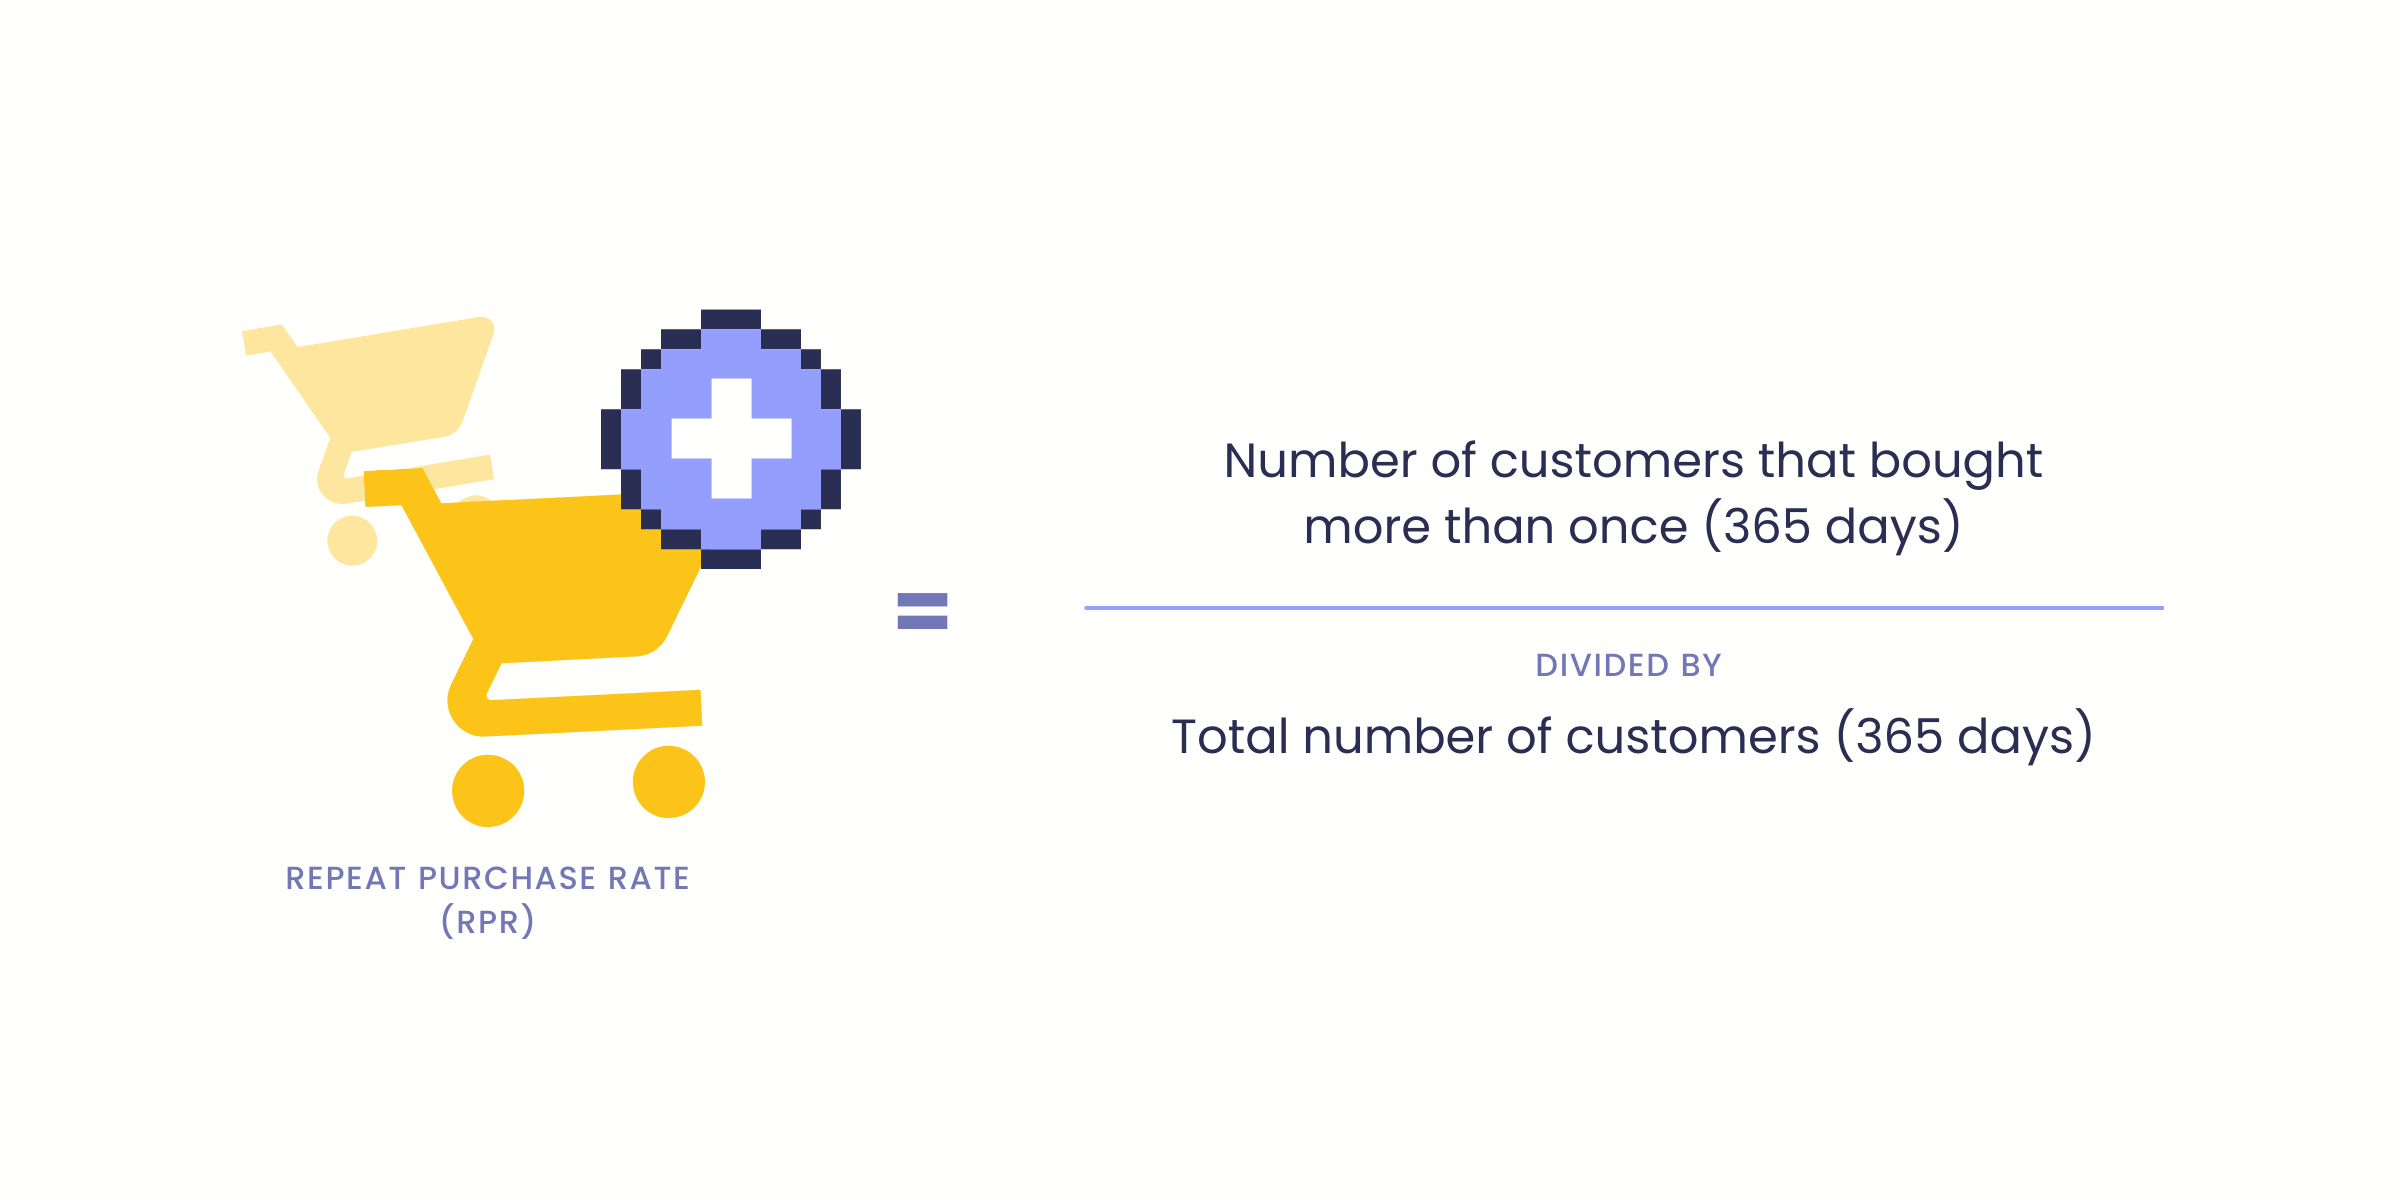
To calculate your repeat purchase rate, you only need two pieces of information—the number of customers who’ve bought more than once and your total number of customers. By dividing the number of customers who have bought from your store more than once by your total number of customers, you’ll get a better idea of how your customer experience impacts customer purchase behaviors.
Improve your Repeat Purchase Rate with a wide variety of rewards
As the backbone of your retention strategy, repeat customer rate gives you insights into the purchase patterns of specific demographics. Appealing to those different customer demographics with experiential and transactional rewards can help you increase the number of purchases each cohort is making.
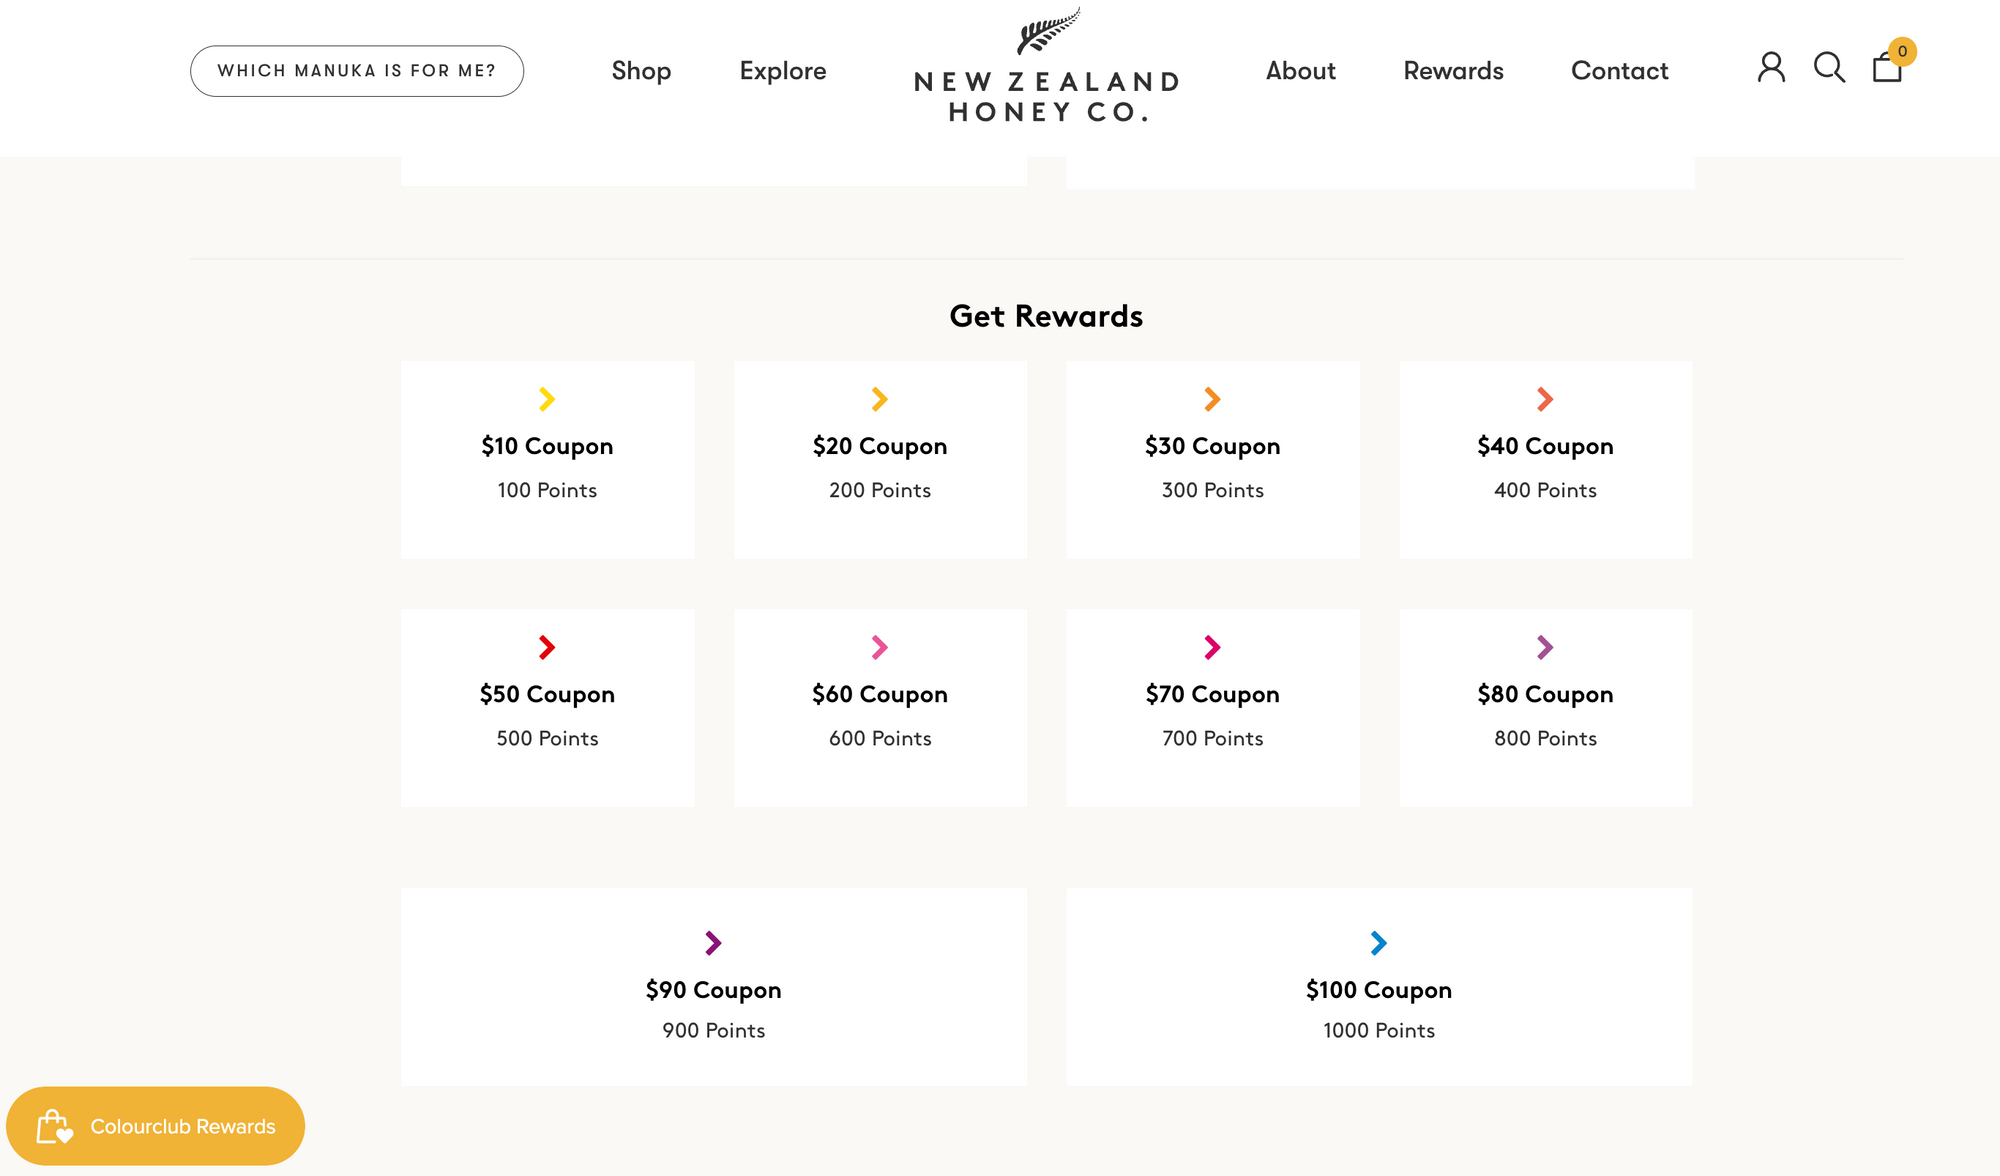
New Zealand Honey Co. rewards customers by letting them redeem points for rewards that are meaningful, such as a price-based discount ranging from $10 to $80 off coupon. That is a significant reward that will incentivize customers to basically unlock a major discount on repeat purchases.
4. Average Order Value (AOV)
Why is Average Order Value important?
This metric is important for one simple reason—it allows you to see how much each of your customers is worth. The more each customer spends per transaction, the less you need to spend to try to get new customers to shop with you. This equates to more money in your pocket and less spent in the competitive ad game.
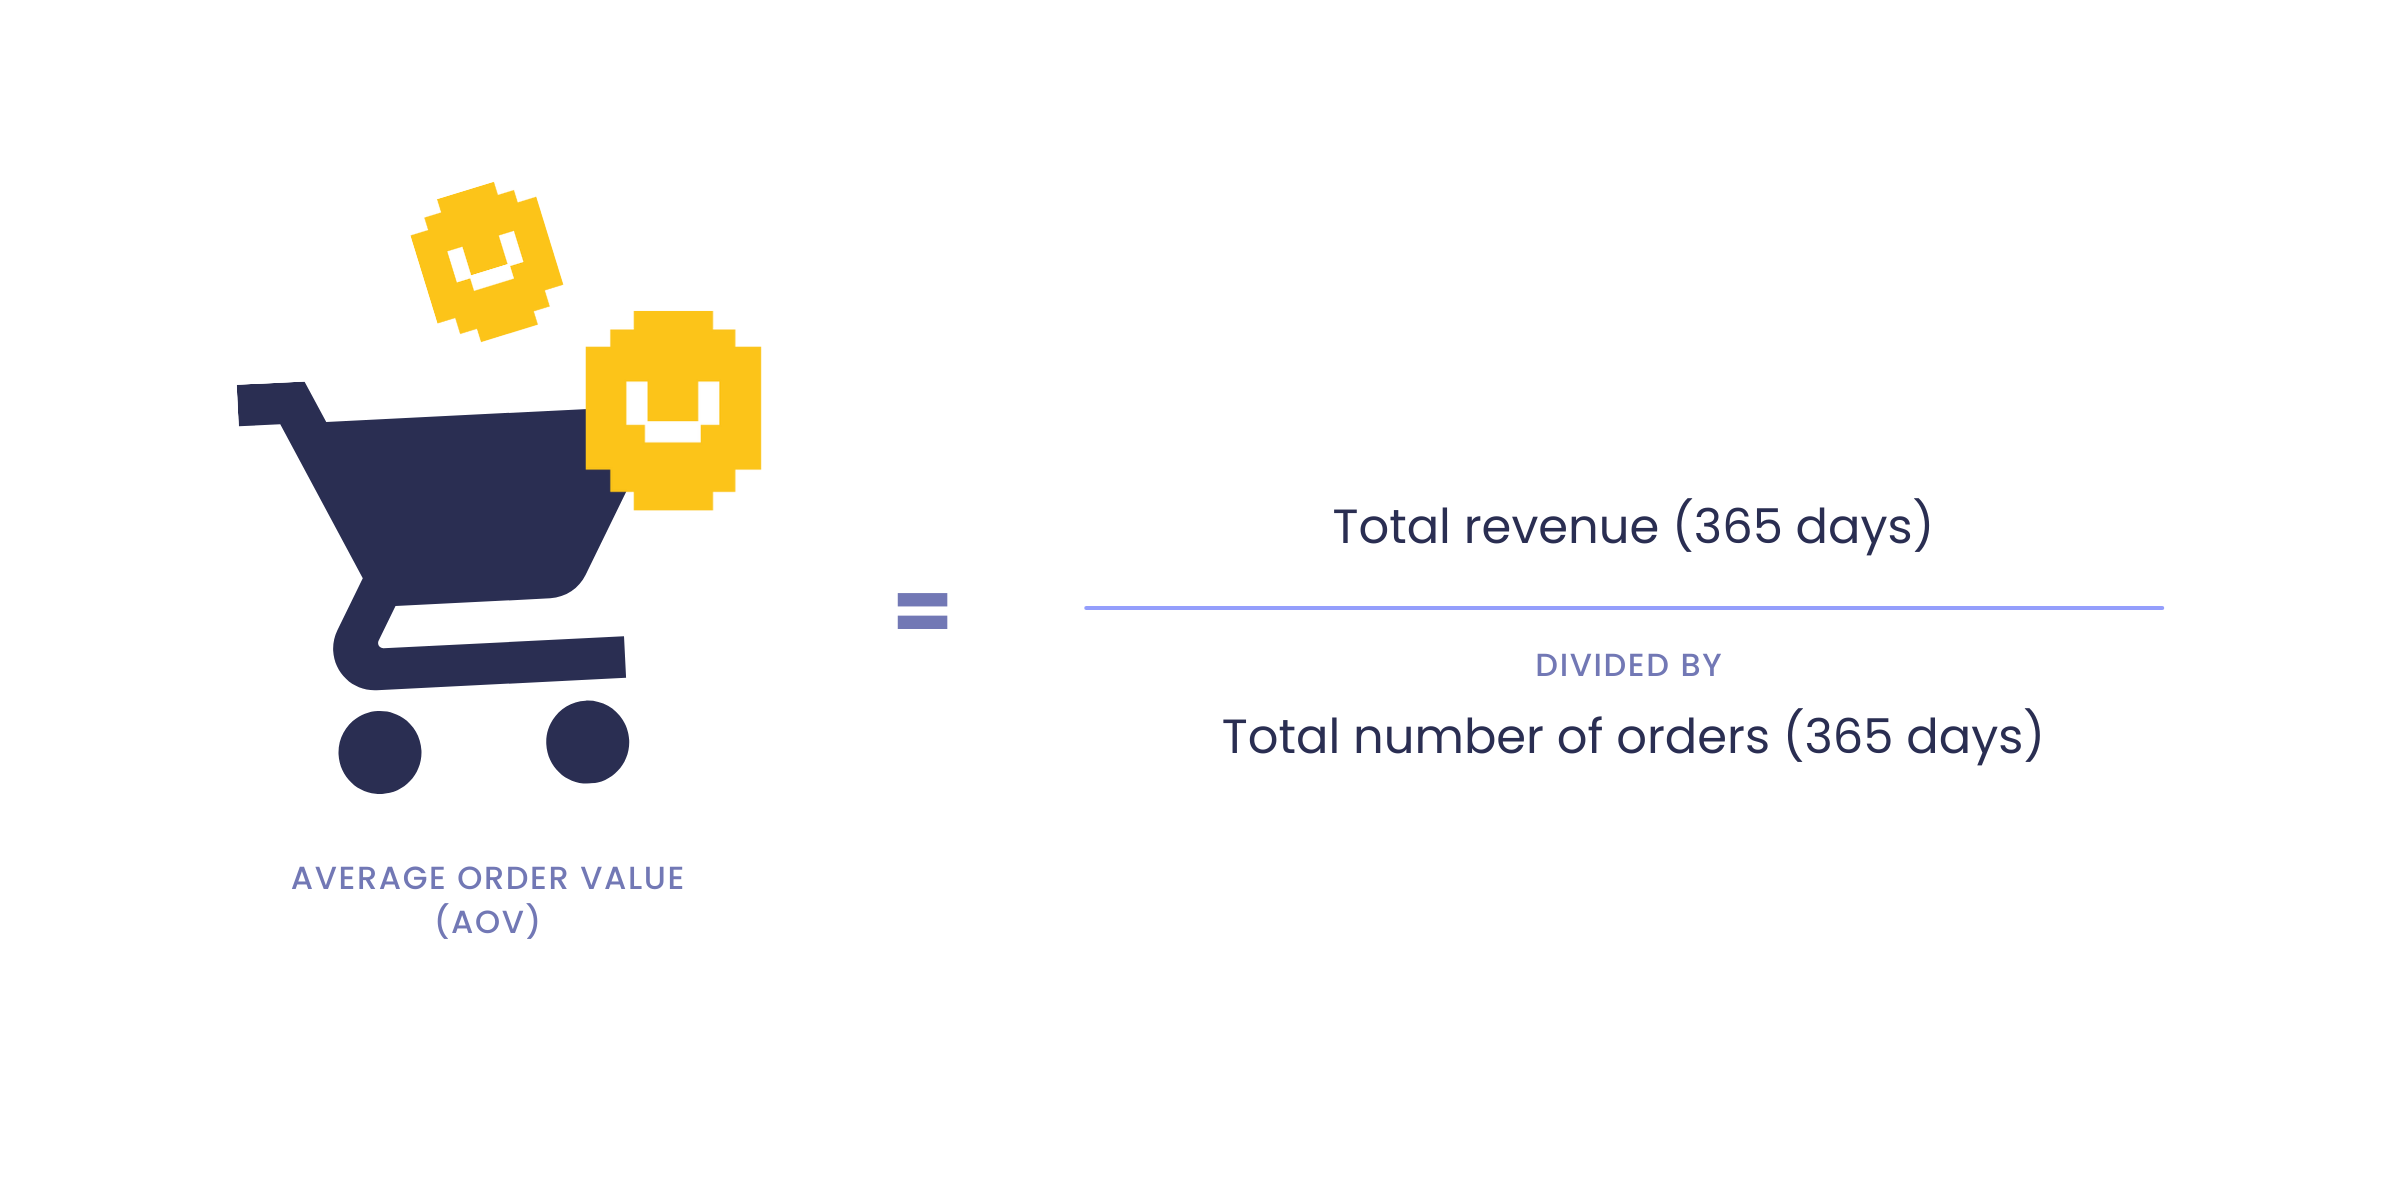
How do you calculate Average Order Value?
To calculate your AOV, you need to look at the total amount of revenue you’ve earned and the number of orders taken. When calculating this retention metric, it’s important to keep in mind that this does not reflect the margin you are generating per order. In order to get the most accurate rate, make sure you’re also subtracting expenses and the costs of goods sold.
Improve your AOV with cross-selling
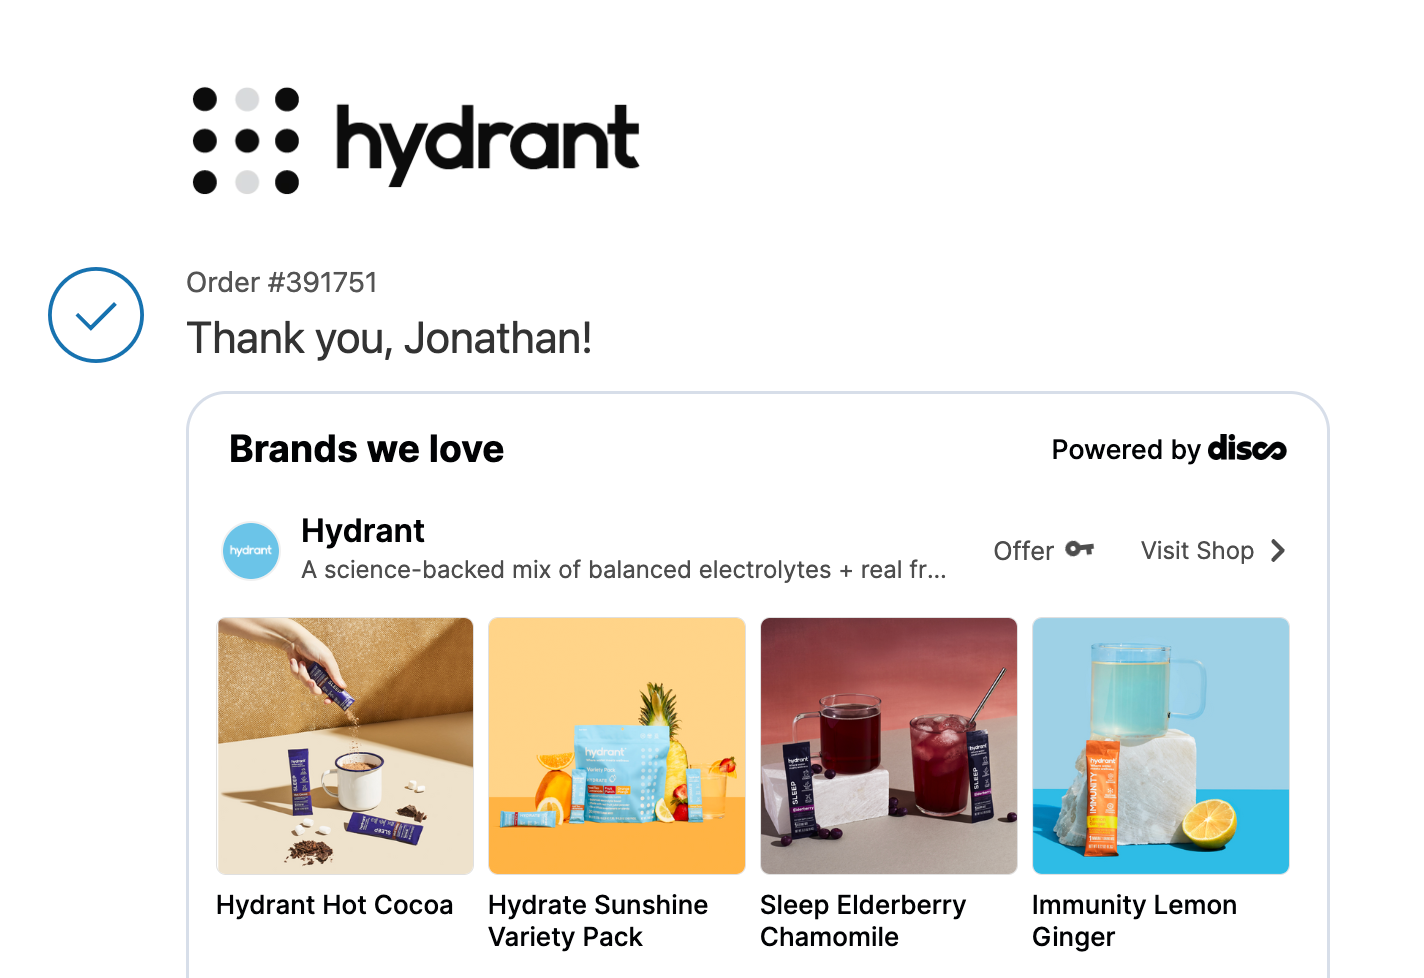
Whether you’re focused on acquisition or retention, the main goal is always to get customers to spend more. Cross-selling products are a great way to encourage customers to increase their AOV and try new products. This example from Hydrant, shows more available products, customers can purchase.
5. Profitability Per Order (PPO)
Why is Profitability Per Order important?
This one should be a no-brainer. The higher your profitability per order (PPO), the higher your overall profits, and the higher your profits, the more successful you are. There’s really nothing else to add!
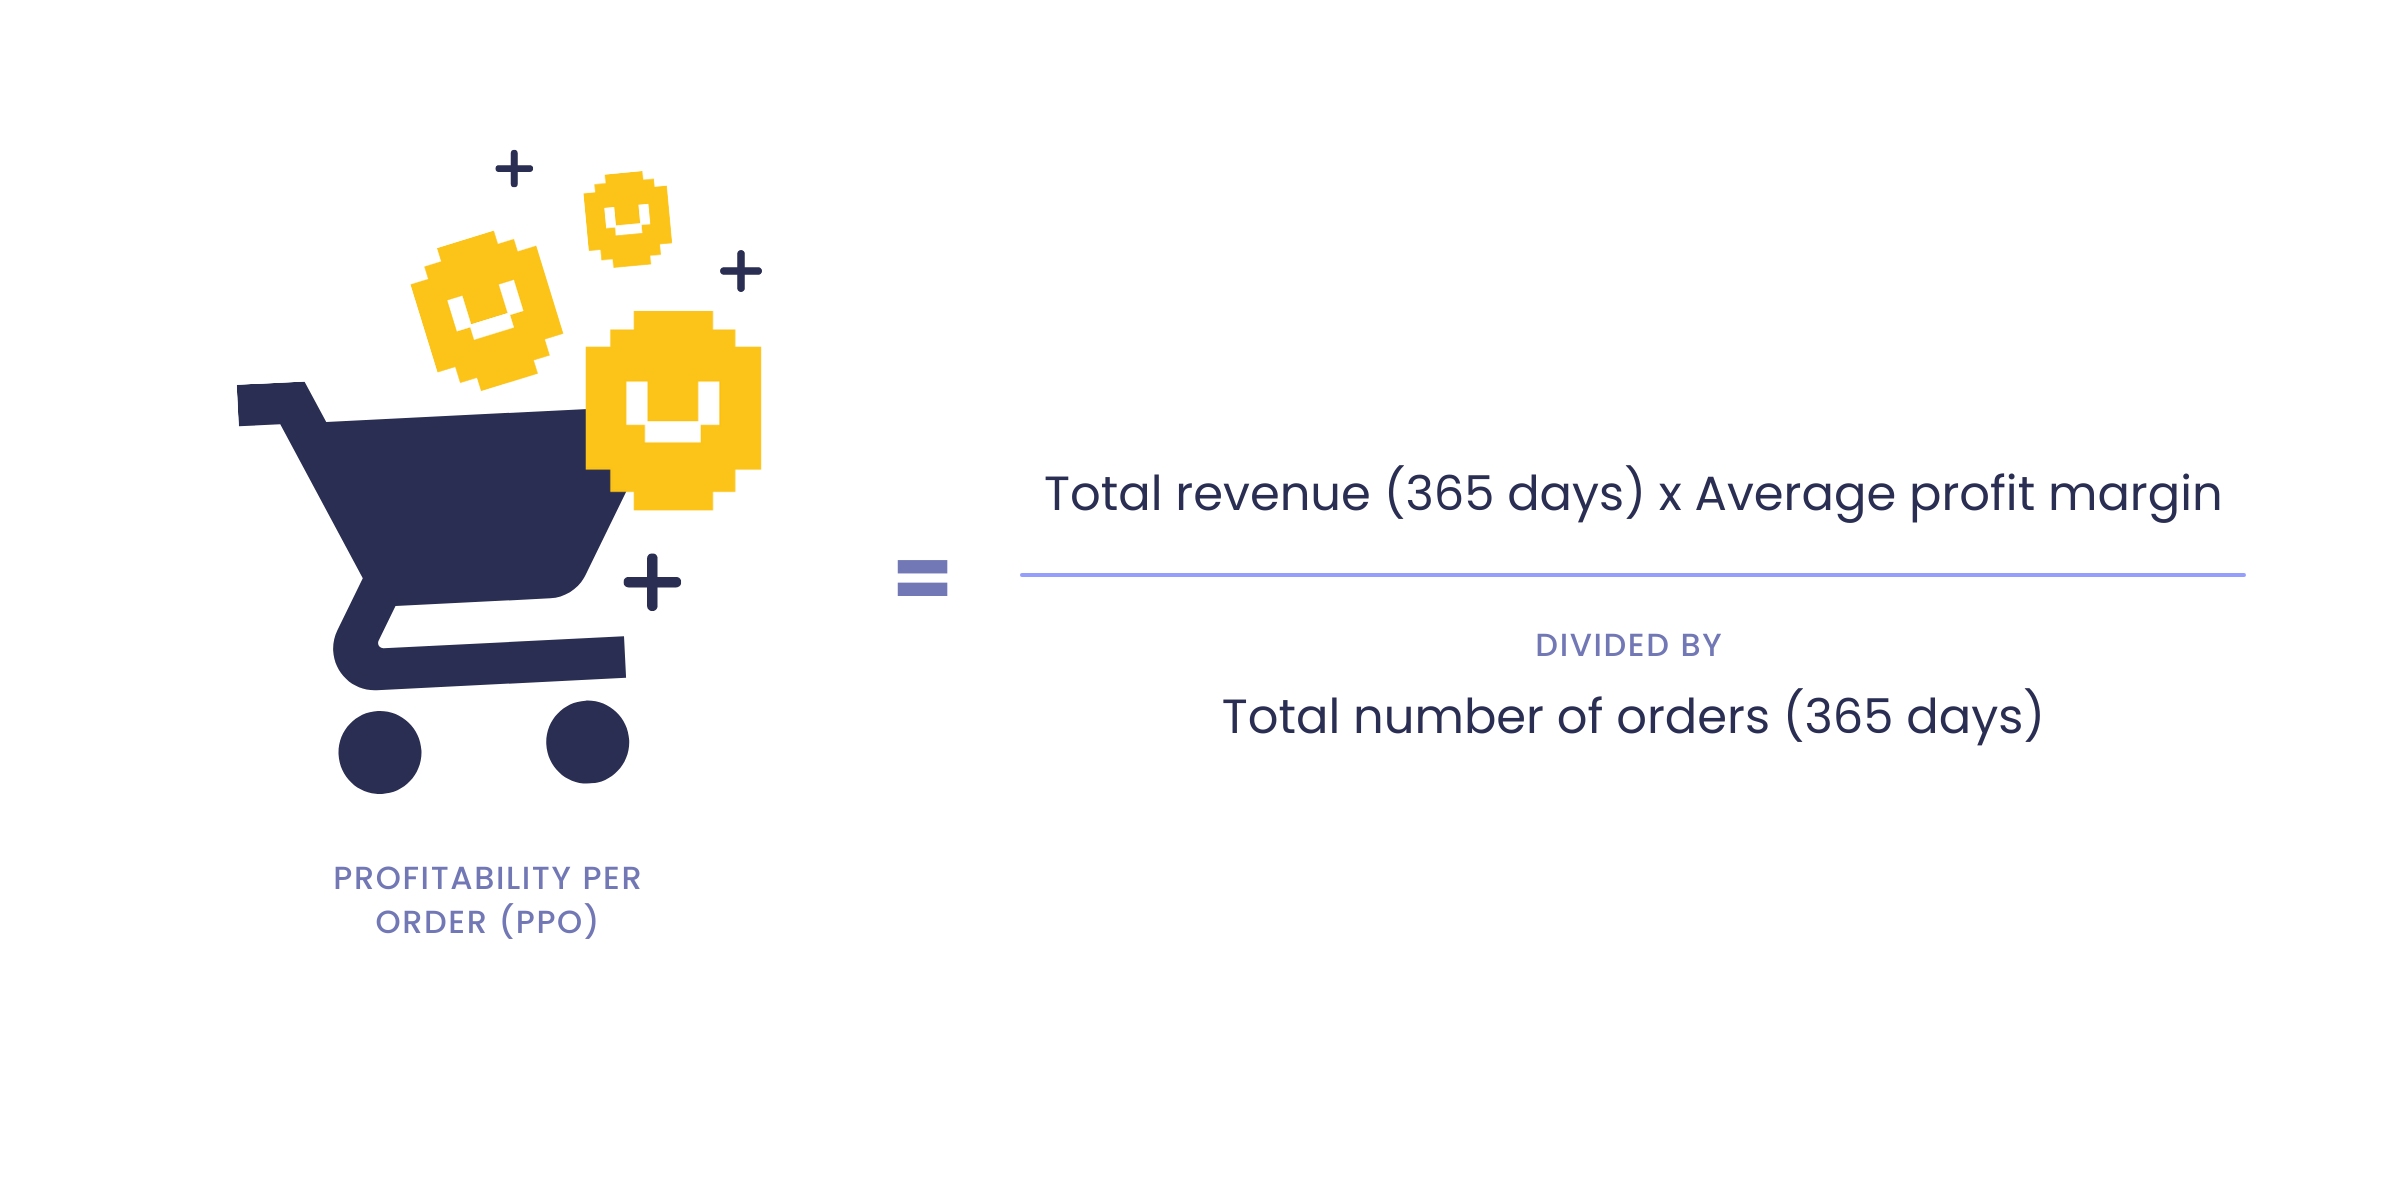
How do you calculate Profitability Per Order?
In order to calculate your profitability per order, you’ll need to know your average profit margin. Once you have that figured out, you simply need to multiply it by your total revenue and divide it by the number of orders.
Improve your Profitability Per Order with customer reviews
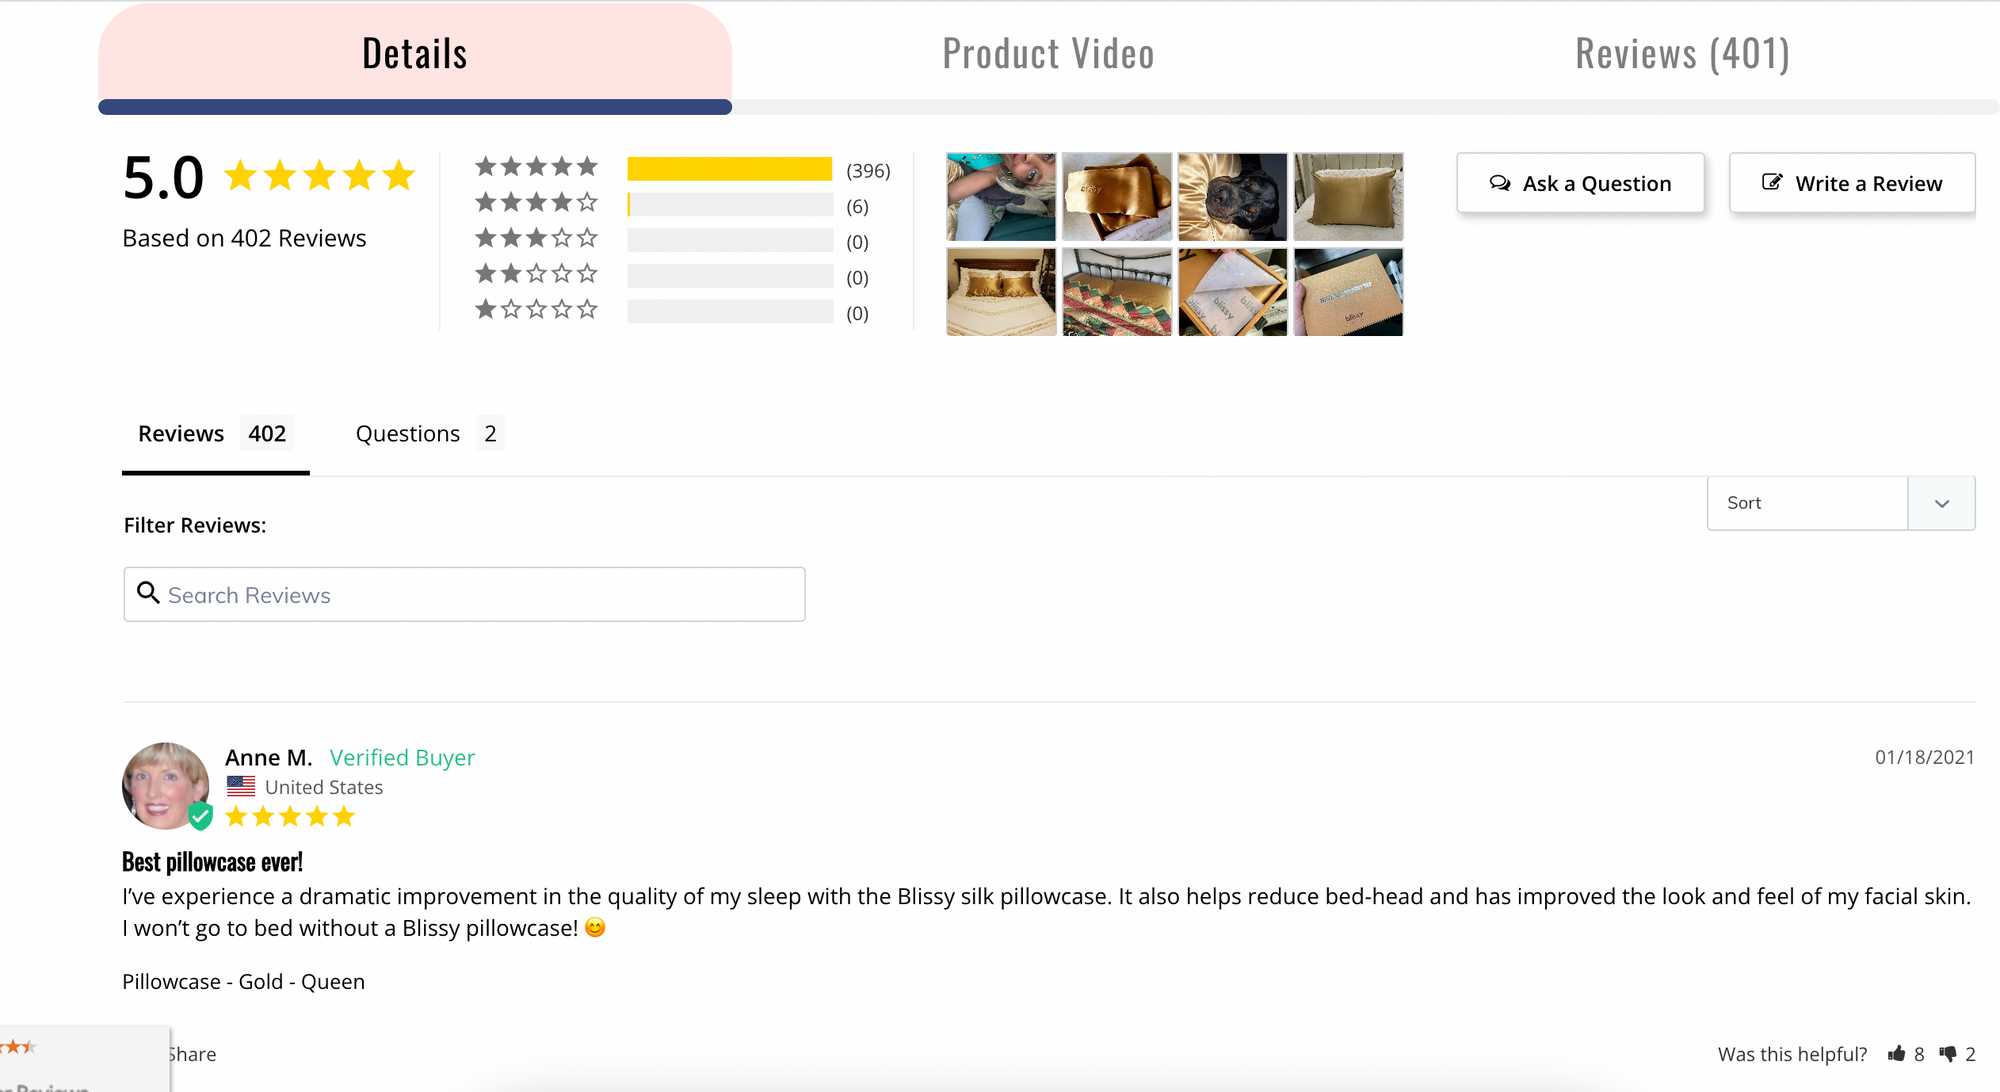
The best way to increase your profitability per order is to push your higher margin products, and the best way to do that is with customer reviews. It’s estimated that 93% of consumers read online reviews before making a purchase. Using your loyalty program to reward customers for leaving reviews will provide you with the ammo you need to help customers build up their baskets.
Tim Peckover
6. Purchase Frequency (PF)
Why is Purchase Frequency important?
This is another no-brainer. Your revenue can only go up when customers make purchases with you. Therefore, an elevated purchase frequency results in more revenue and higher profitability.
How do you calculate Purchase Frequency?
You can easily calculate your purchase frequency by dividing your total number of orders made in 365 days by the number of unique customers you’ve had in the same time period.
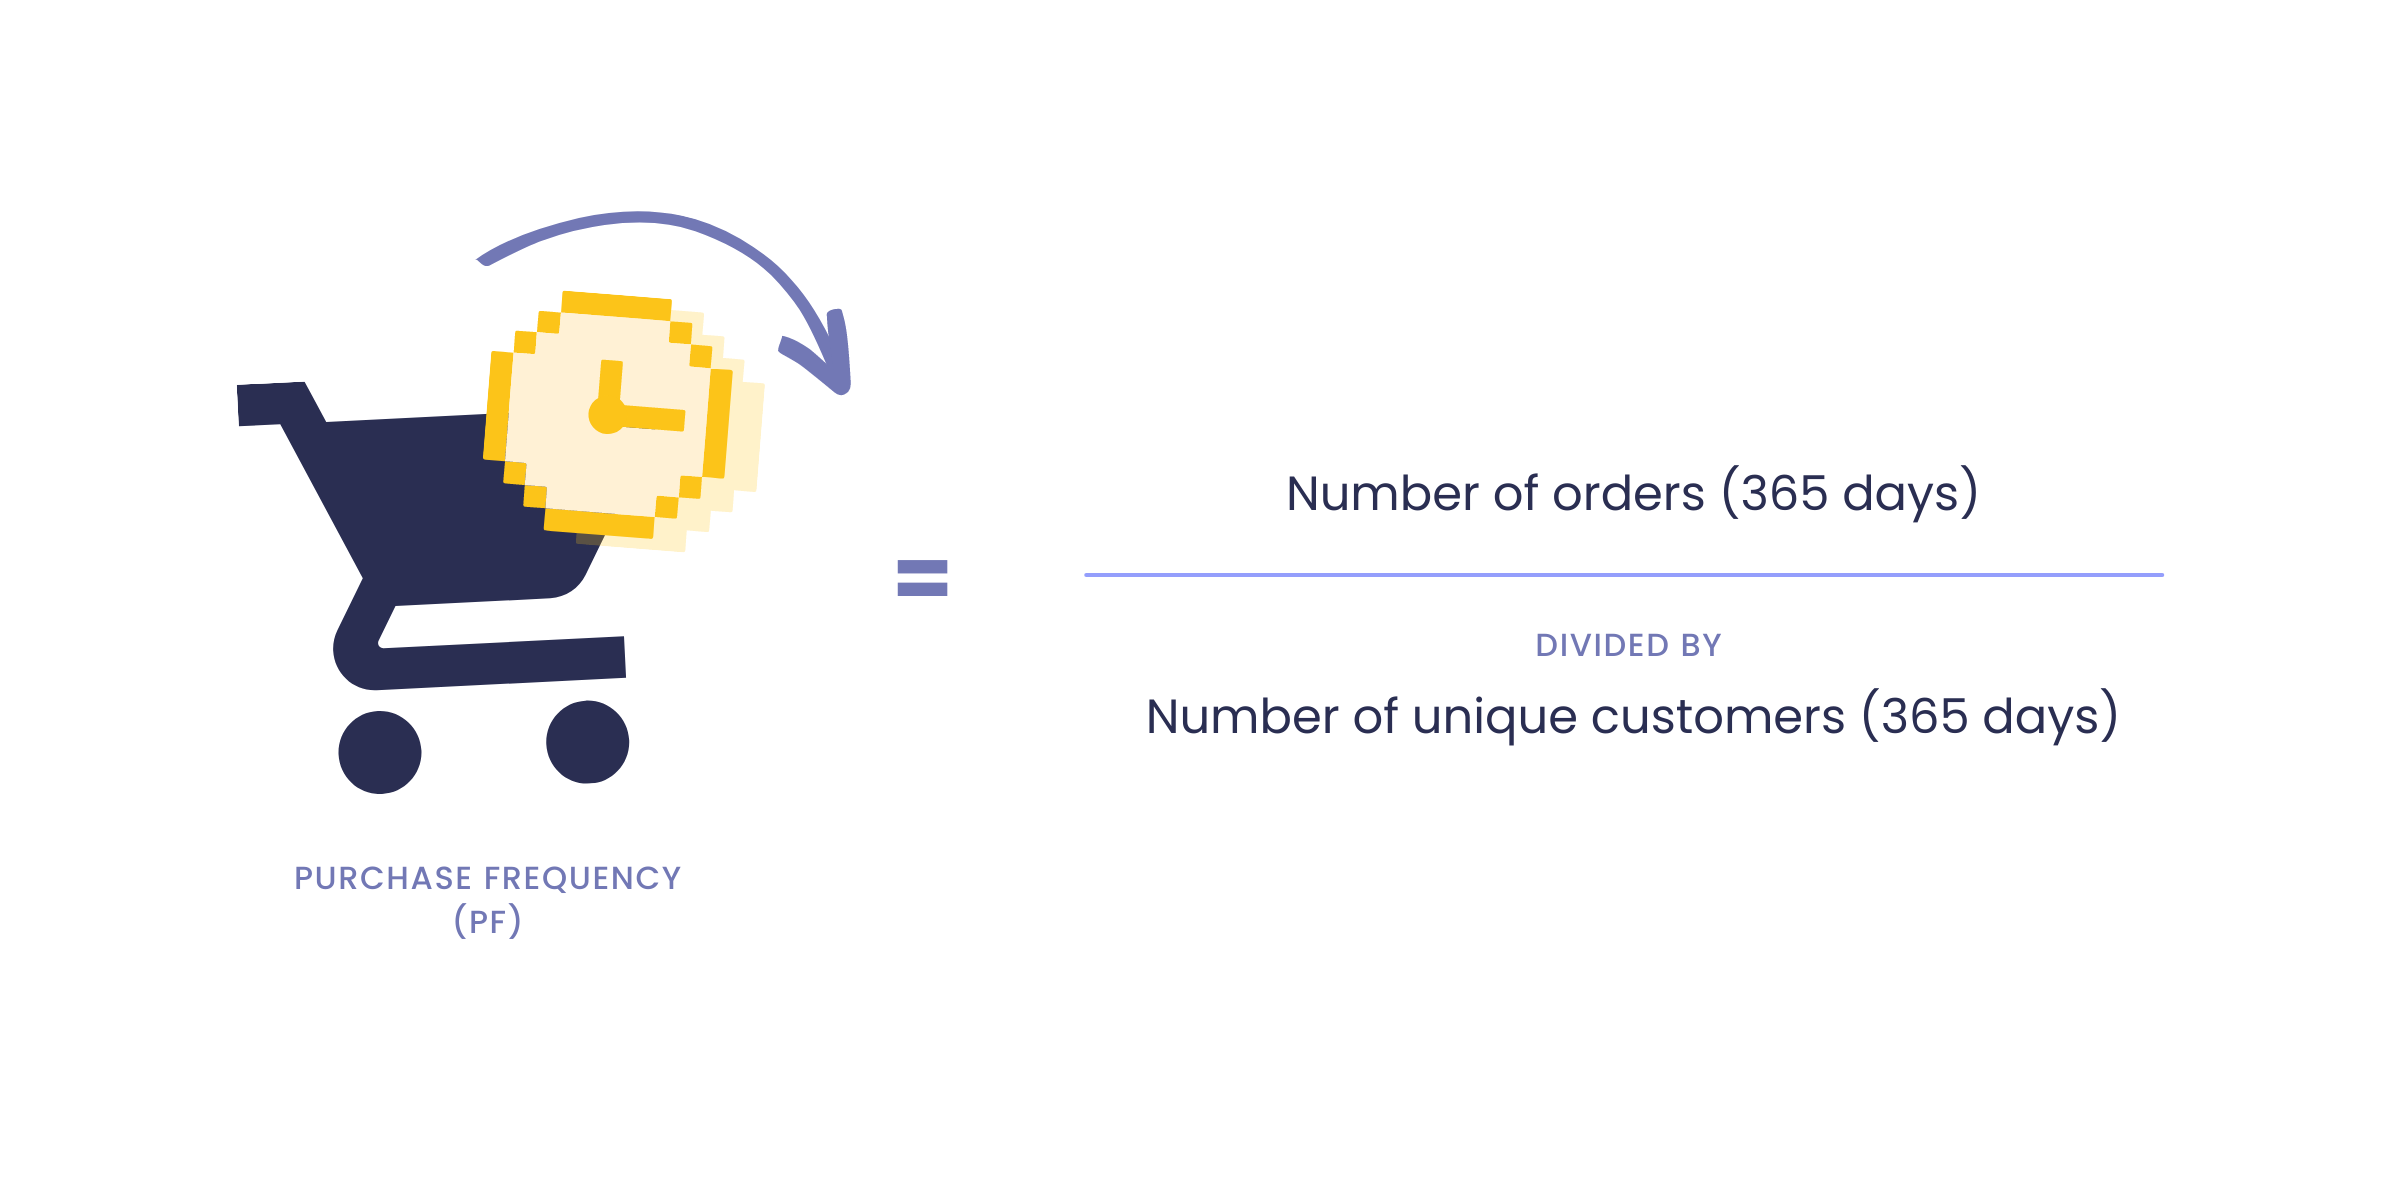
The key to calculating your store’s purchase frequency is to use the number of unique customers. Otherwise, you could skew the data and get an inaccurate calculation.
Improve your Purchase Frequency with personalized retention emails
Most customers won’t spend more money just for the sake of spending money, which means you need to create an experience they simply can’t refuse. Sending personalized, relevant messages to shoppers on a semi-regular basis will keep your business top-of-mind and help establish an emotional relationship between you and your customers. This relationship is what will bring them back and have them click the “buy now” button more often.
Gabrielle Policella
7. Time Between Purchases (TBP)
Why is Time Between Purchases important?
When you know how long it takes the average customer to make another purchase, you can begin to target their buying patterns with retention strategies designed to increase their desire to buy. This knowledge positively impacts your ability to maximize revenue.
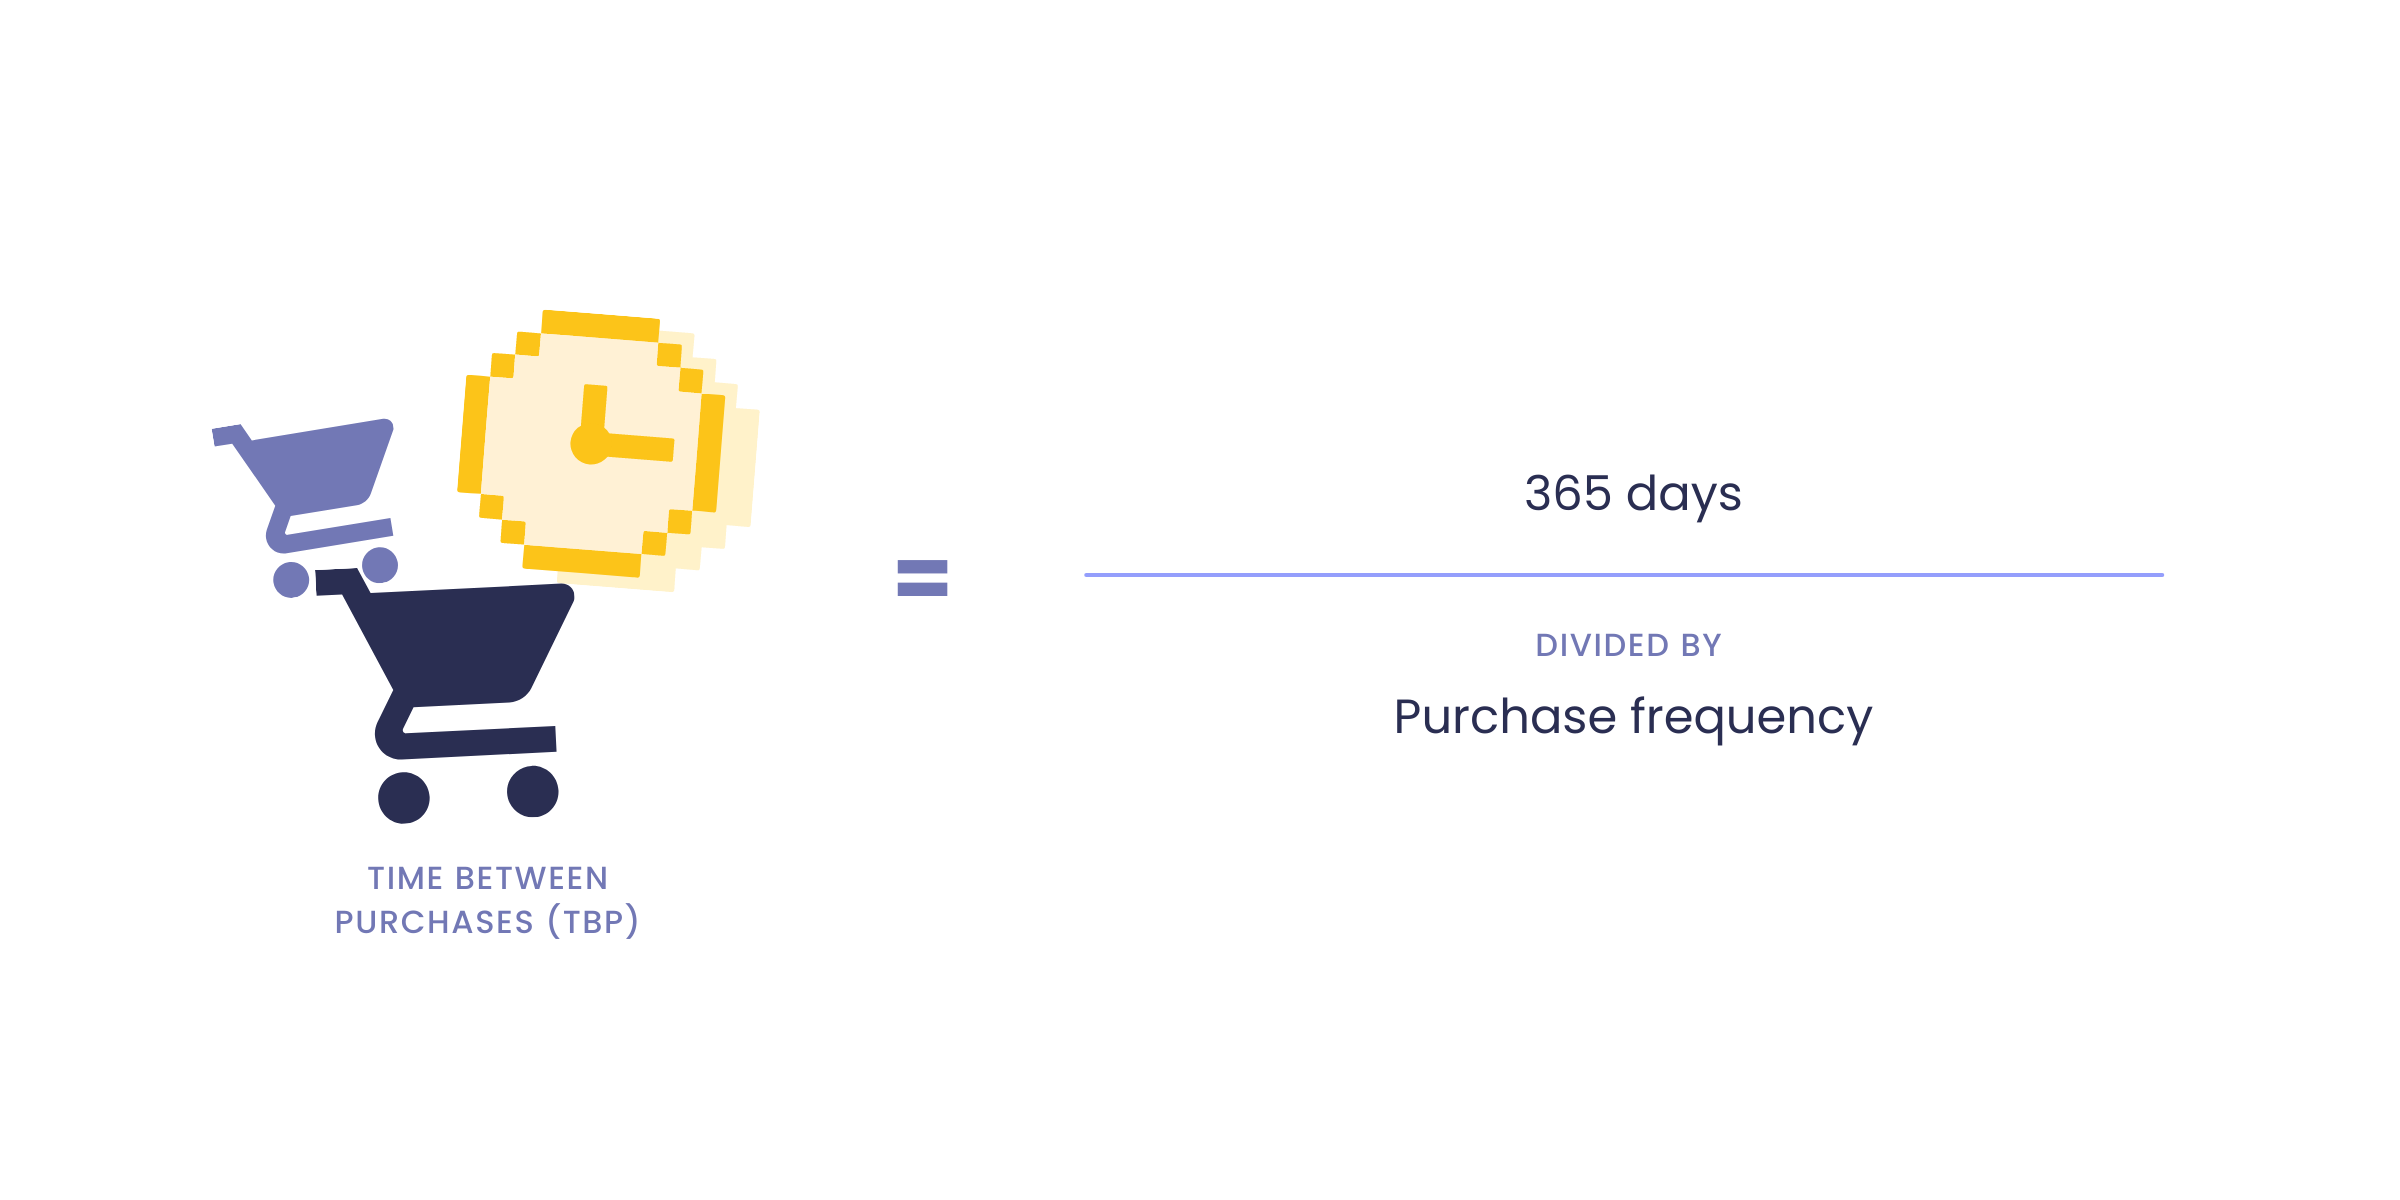
How do you calculate Time Between Purchases?
Time between purchases and purchase frequency go hand in hand—you can’t have one without the other! In order to calculate your time between purchases rate, you’ll need to know your purchase frequency. When you have that calculated, you can calculate the average time between purchases by dividing 365 days by your purchase frequency.
Improve Time Between Purchases with automated flows
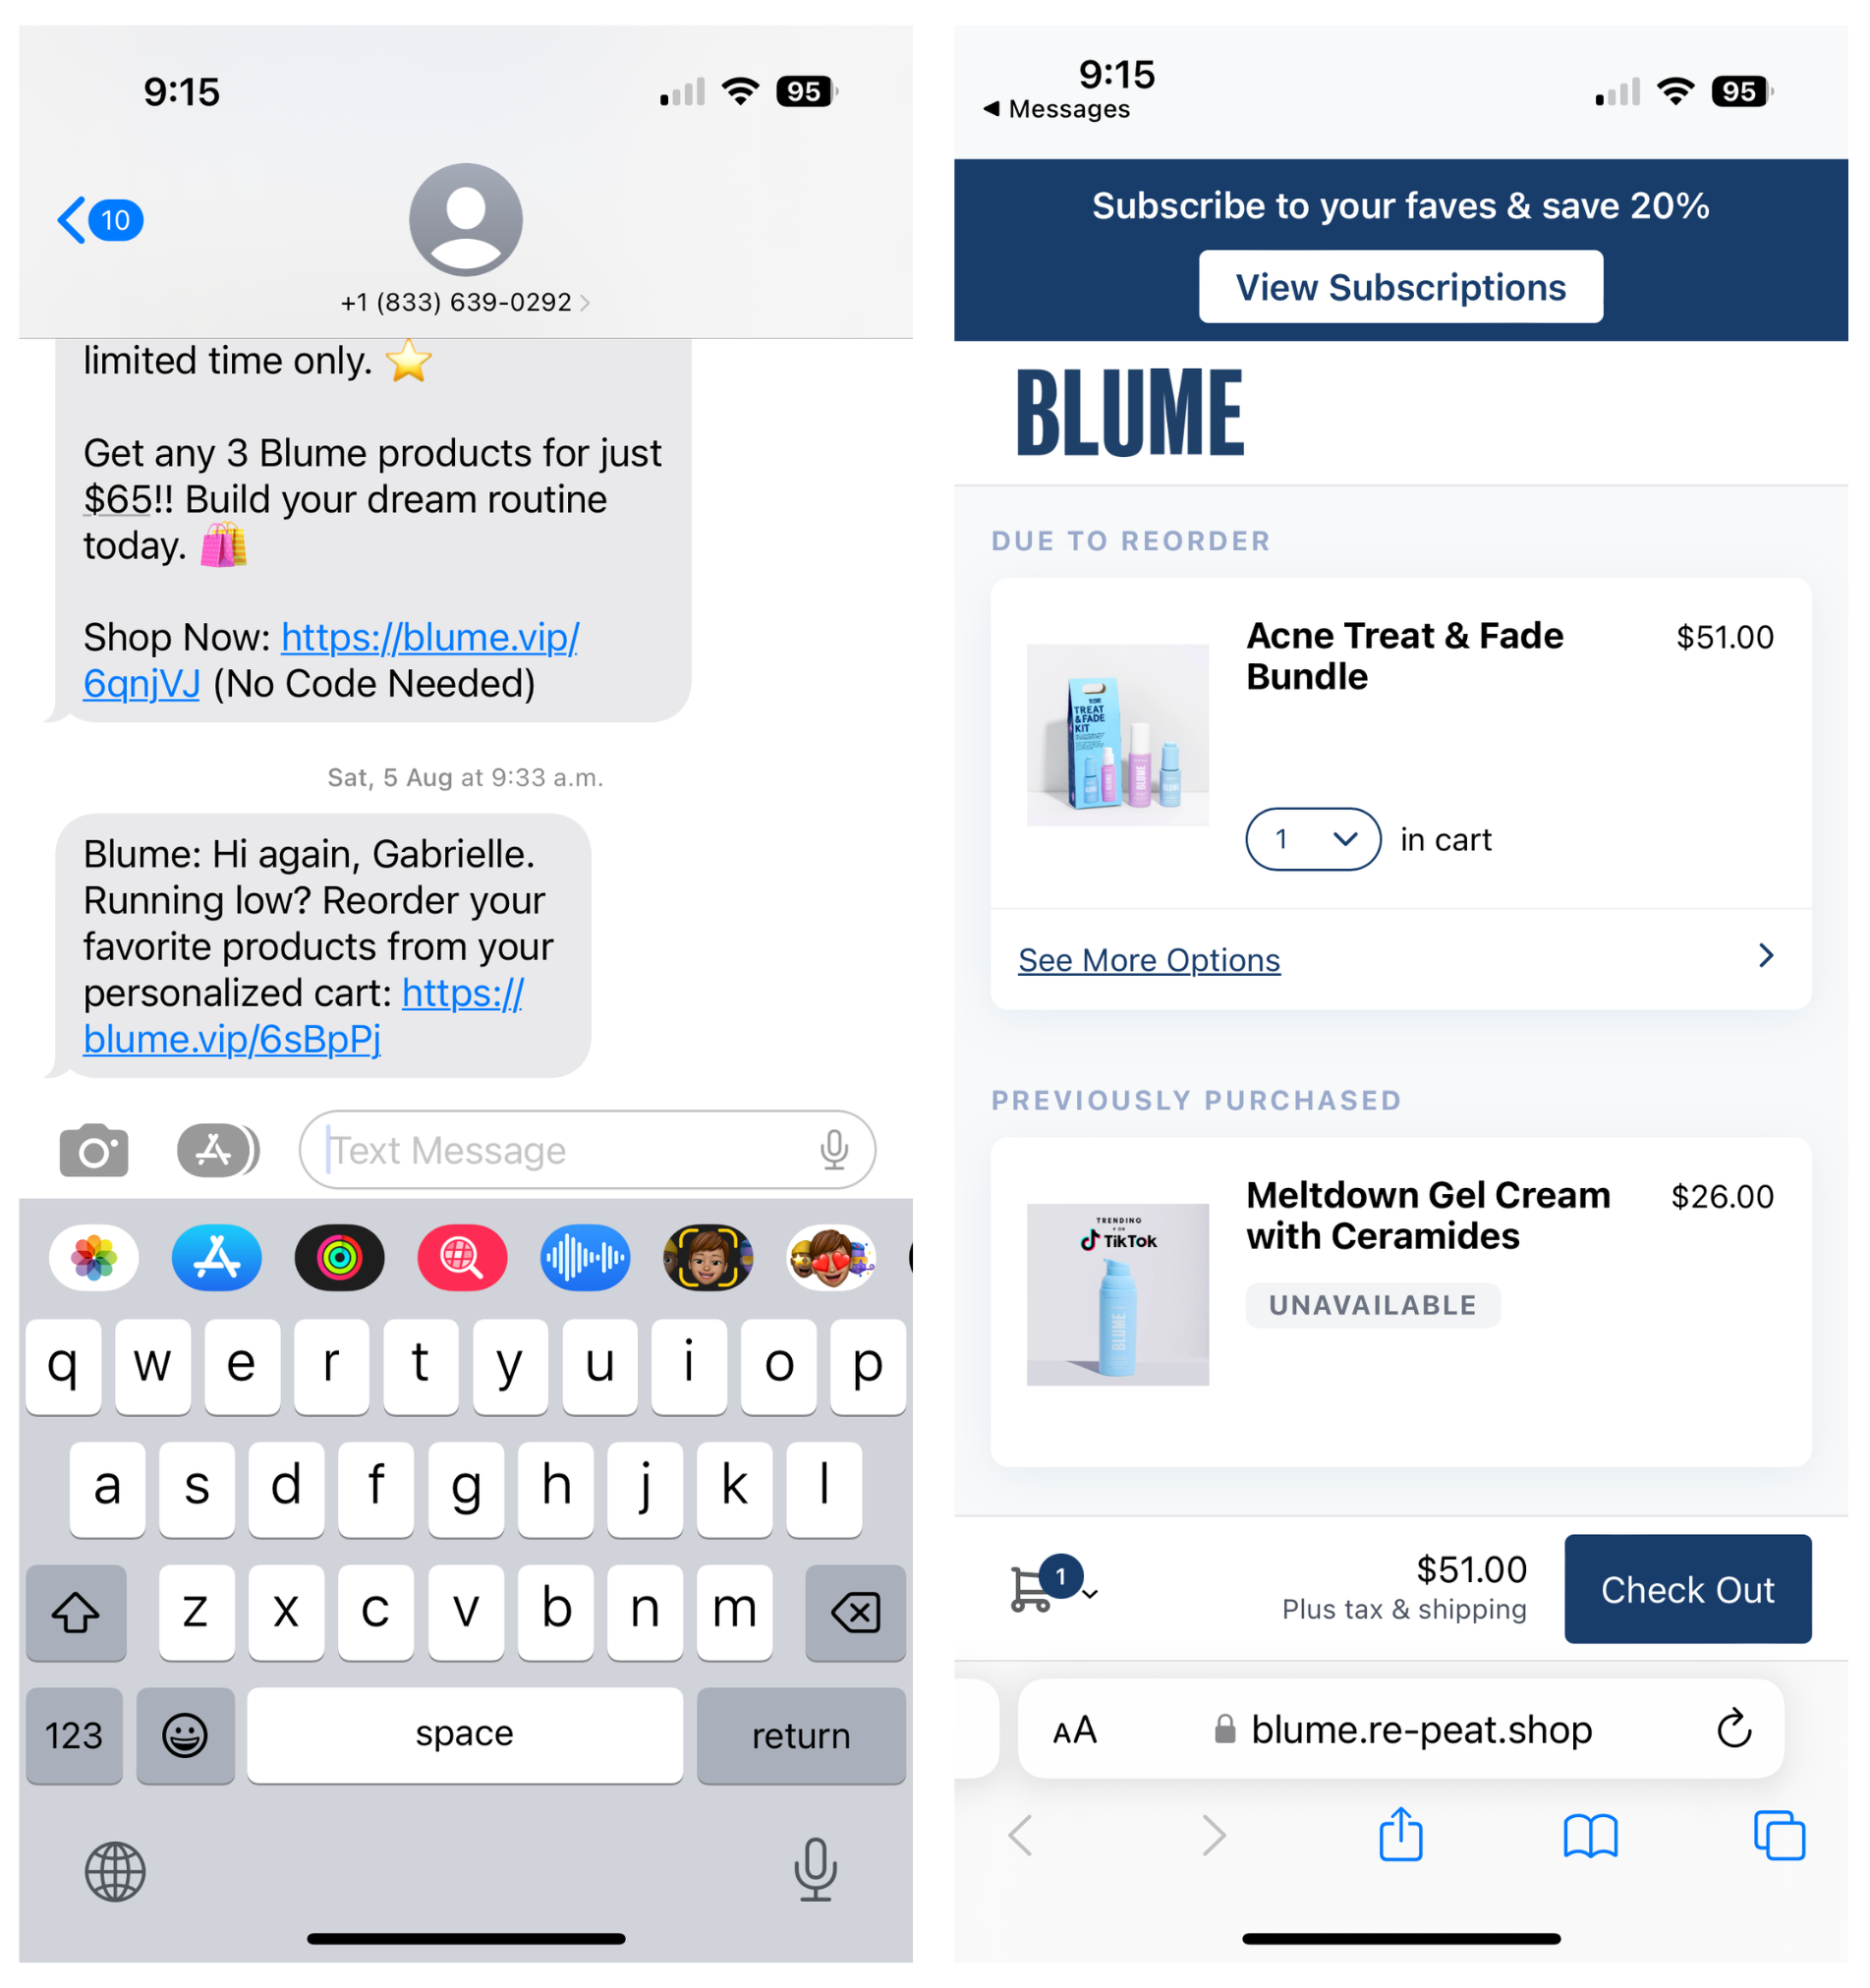
Automation has been a secret power for major ecommerce brands. Whether it's automating content, emails, or SMS to your customers, automation can save you time and improve the time between purchases. Understanding the customer journey is vital to improving this type of retention metric.
Using SMS and automated flows to communicate with your past and current customers will remind them of when it's time to reorder a product, or simply help you gauge your customers’ satisfaction with their experience. Ultimately, creating a two-way communication loop that builds trust and strengthens their relationship with your brand. Beauty brand Blume, uses SMS to automate communication with its customers, and point them to its products.
Jimmy Kim
8. Customer Lifetime Value (CLV)
Why is Customer Lifetime Value important?
This retention metric is extremely important because it gives you the best understanding of how much you should be spending on acquisition costs. The higher your customer lifetime value, the lower your acquisition costs need to be. This allows you to rebalance your marketing budget to focus on profitable retention strategies instead of costly acquisition ones.
How do you calculate Customer Lifetime Value?
Customer lifetime value is one of those retention metrics that require a couple of pieces in order to calculate it. These pieces are customer value and the store’s average life span.
Once you have those variables in hand, the calculation is surprisingly easy:
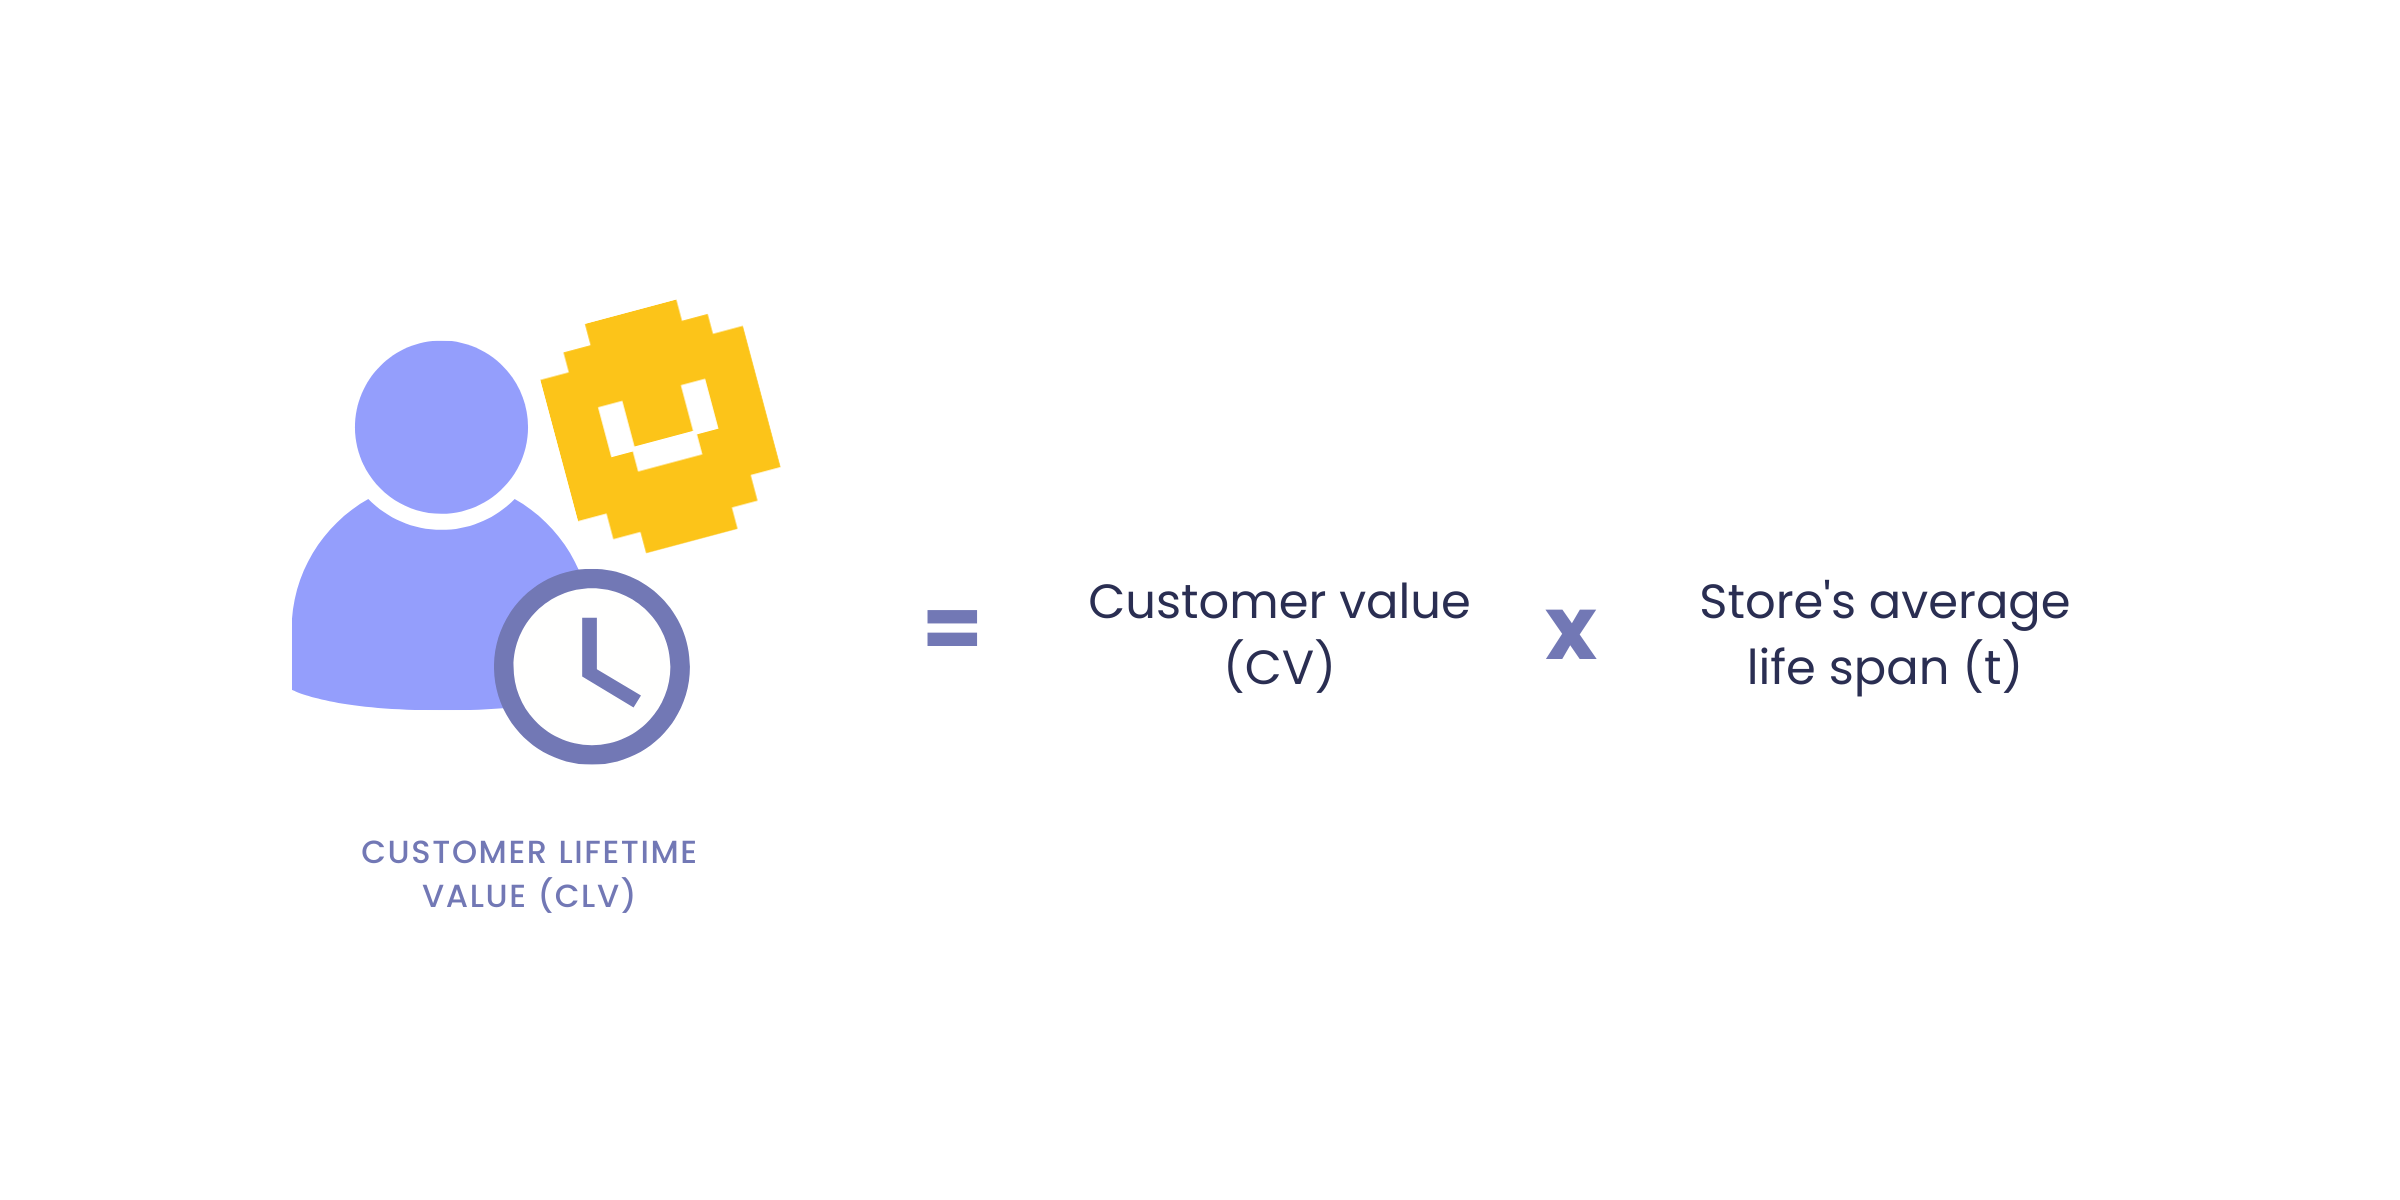
By combining data from your average order value and purchase frequency, your customer lifetime value will give you a good idea if customers are spending more and purchasing more frequently. If your customer lifetime value rate is increasing over time, you know you’re in a good spot!
Improve your Customer Lifetime Value by making your brand convenient
Customers will be more likely to choose your brand if you’re easy to access and quick to shop with. This is why mobile commerce has become a major factor when launching an ecommerce brand. Your focus should be very much on delivering a great customer experience from a mobile perspective.
2 billion people will make mobile purchases this year, so having a well-designed mobile website that integrates with your loyalty program will make your brand a highly convenient choice for this huge market of shoppers.
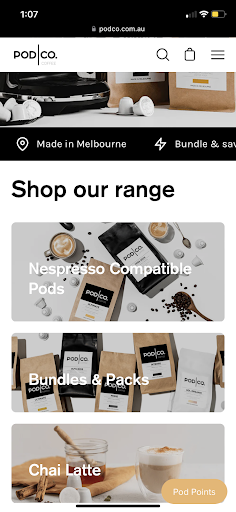
Customers will be more likely to choose your brand if you’re easy to access and quick to shop with. This example from coffee brand Pod Co has a mobile site that is easy for customer to navigate. It’s estimated that 2 billion people will make mobile purchases this year, so having a well-designed mobile website that integrates with your loyalty program will make your brand a highly convenient choice for this huge market of shoppers.
9. Redemption Rate (RR)
Why is Redemption Rate important?
This retention metric is the best indication of how healthy your loyalty program is. Customers will only redeem points for a reward if they see the reward as valuable, so your brand’s redemption rate is very closely tied to program engagement. This knowledge is invaluable when it comes to assessing and improving your loyalty program.
How do you calculate Redemption Rate?
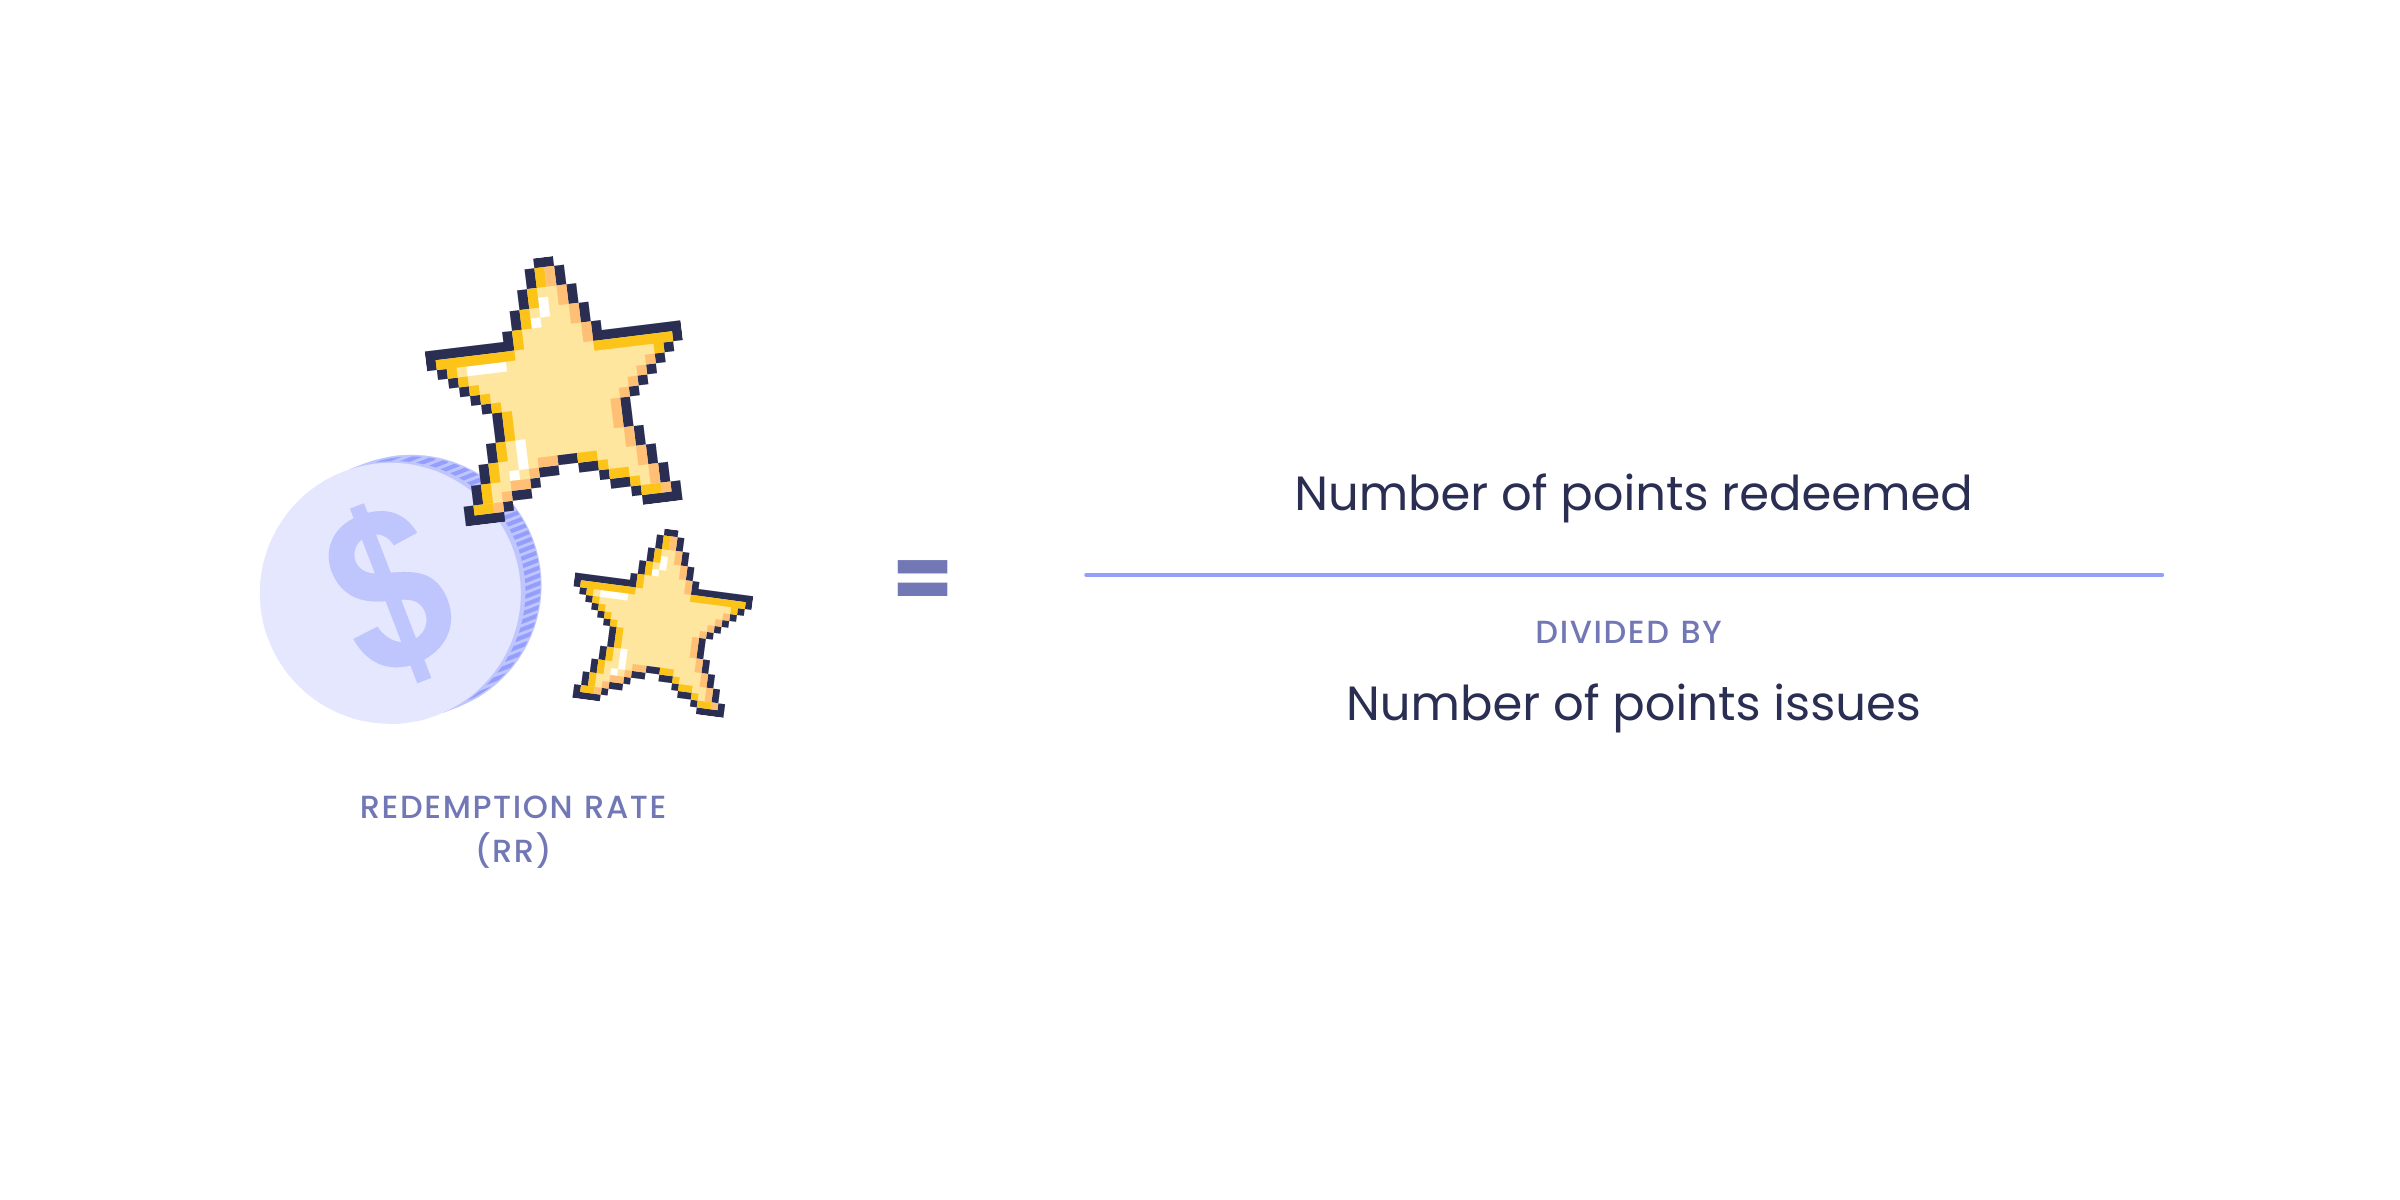
To calculate your redemption rate, all you need to do is divide the number of reward points that have been redeemed by the number of points you’ve issued.
Improve your Redemption Rate with more ways to earn rewards
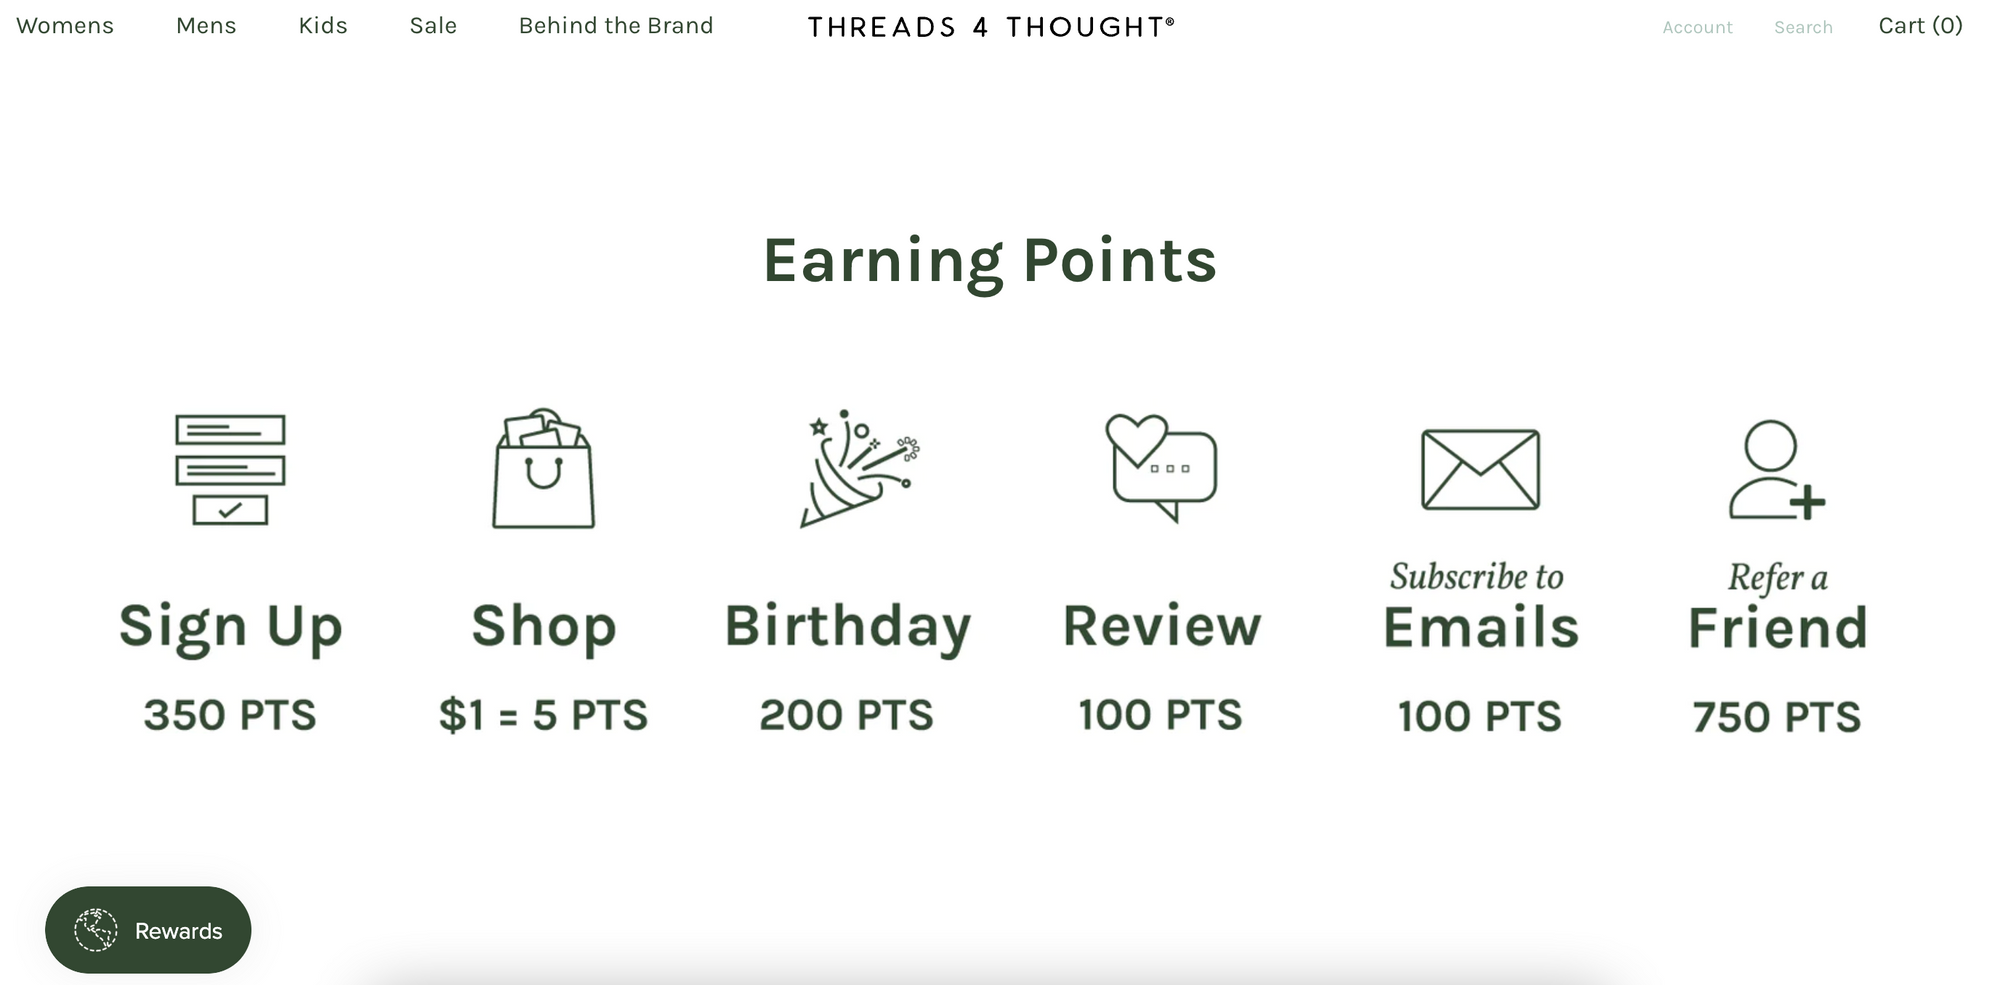
In general, a good redemption rate should be around 20% after 6 months. If this rate is lower, you need to assess whether the rewards you’re offering and the way to earn them are truly valuable to customers. Offering more ways to earn rewards can help you combat a sluggish redemption rate and build a program that truly adds value to your customer experience.
10. Customer Retention Rate (CRR)
Why is Customer Retention Rate important?
The higher your customer retention rate, the more successful your retention strategy is, letting you know that you’ve achieved your retention marketing goals.
How do you calculate Customer Retention Rate?
This calculation is one of the trickier ones on the list simply because it includes more variables. However, once you know what those variables are, you’ll see that there’s nothing to worry about!
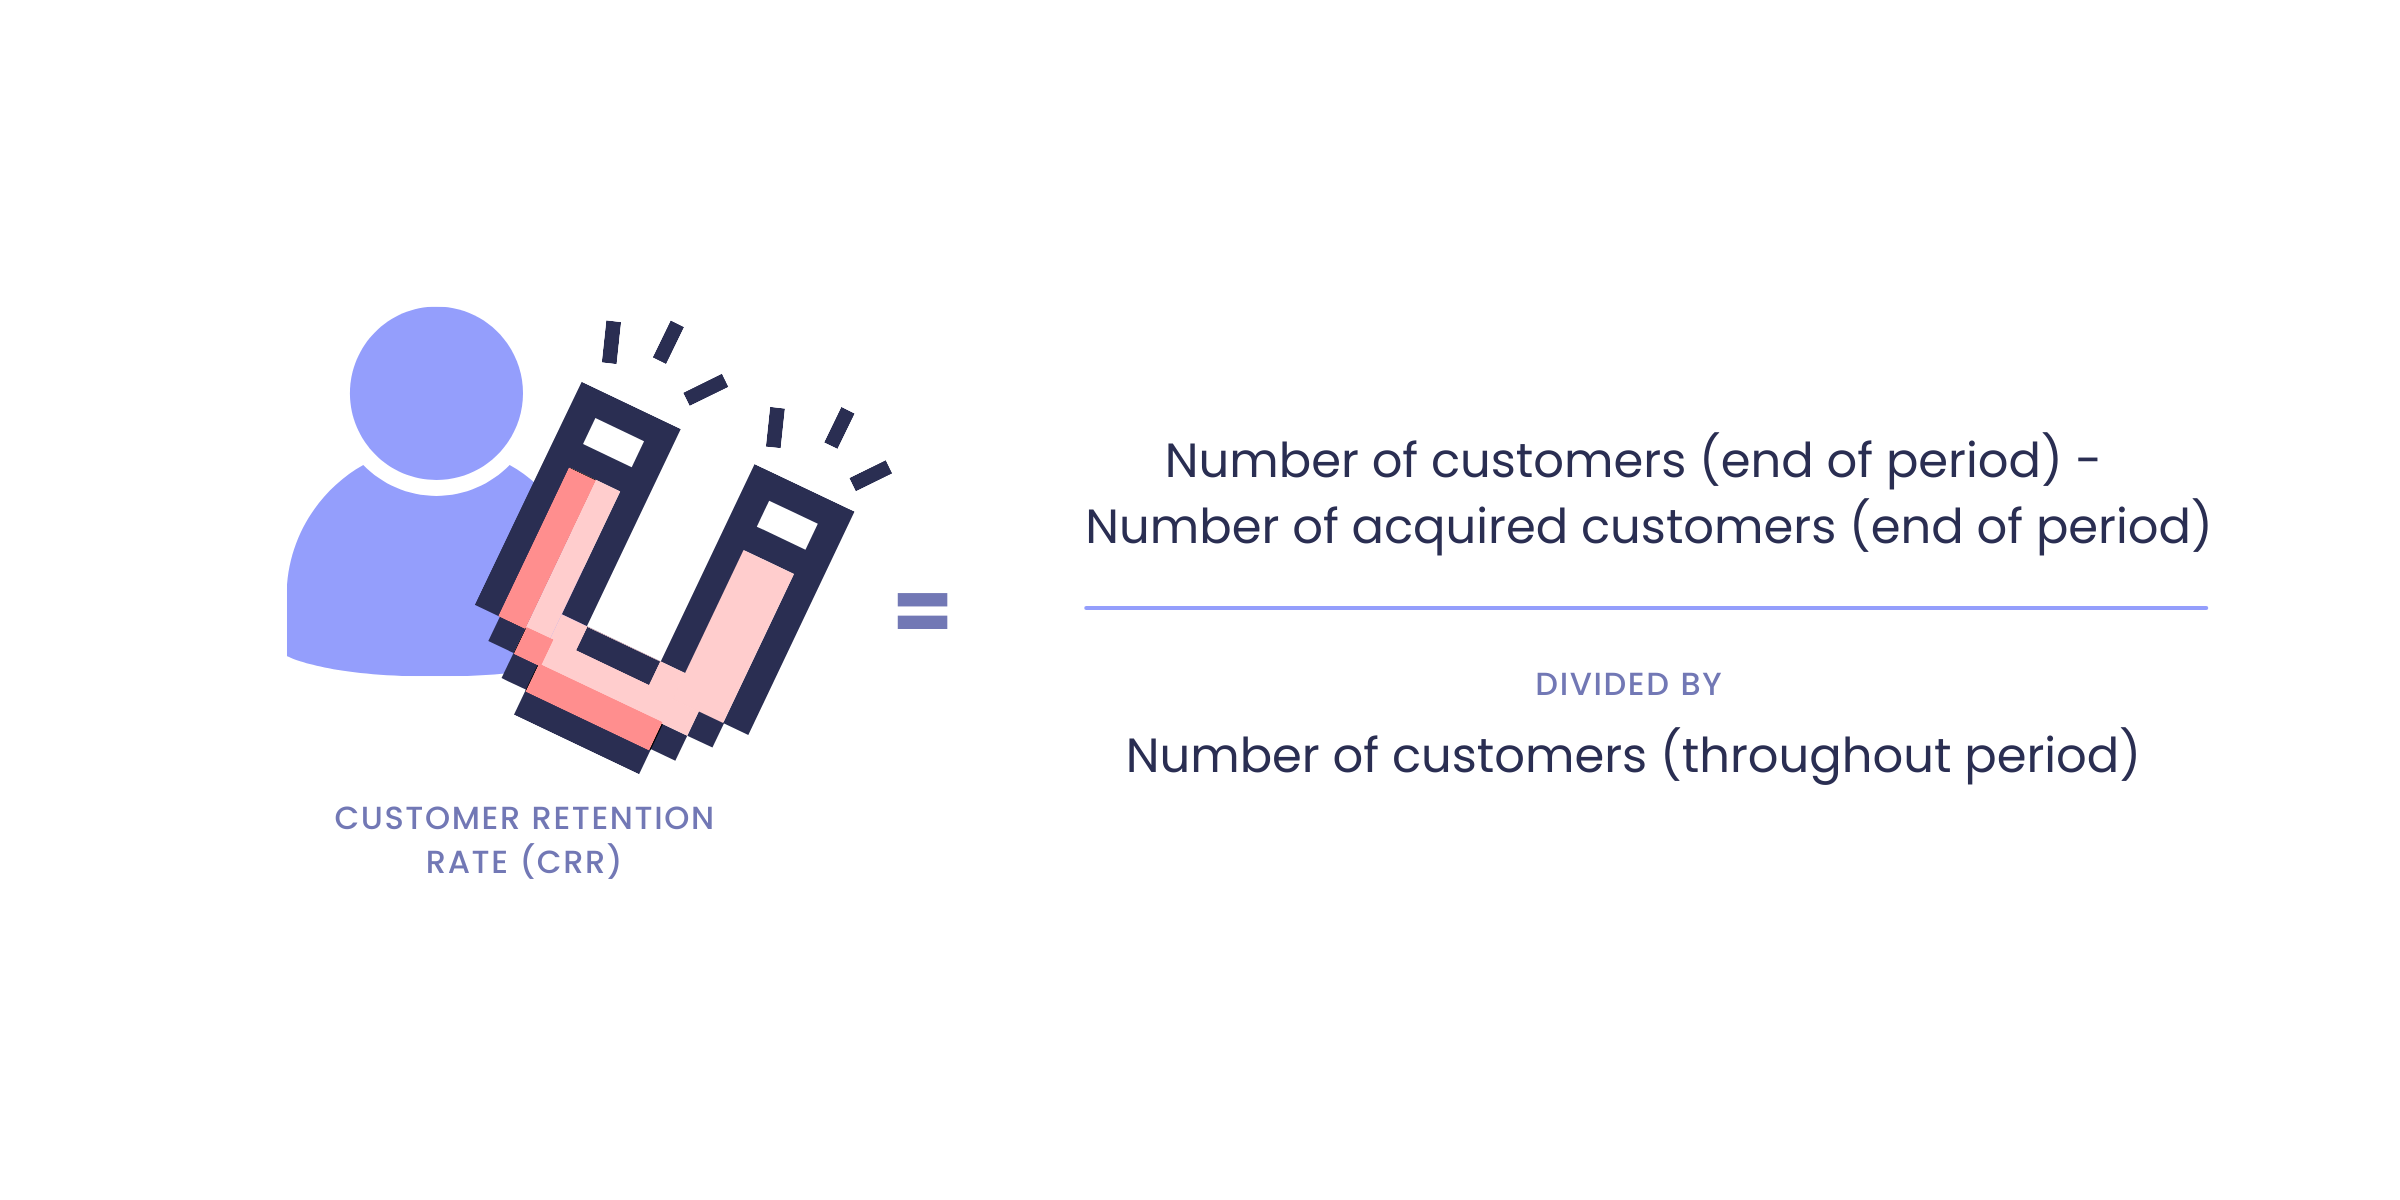
While you can use any period you want, we recommend using a year (365 days). It’s a lot easier to manage and gives you a broader idea of how well your retention marketing efforts are working.
Although the desired rate is different for every industry, you want to be aiming for a customer retention rate of 85-90%.
Alex McEachern
Improve your Customer Retention Rate with retention marketing
You can improve your customer retention rate through any combination of the retention tools and strategies we’ve already talked about. Retention marketing increases both the number of return customers and the profitability of existing customers.
11. Loyal Customer Rate (LCR)
Why is Loyal Customer Rate important?
This metric is the true reason you started retention marketing in the first place! As it gets harder and harder to secure brand loyalty, you want to make sure that your retention efforts are working to acquire and retain customers who are truly committed to your brand. In the long run, these loyal customers are who will help attract and convert new shoppers into lifelong shoppers, making them invaluable to the success of your business.
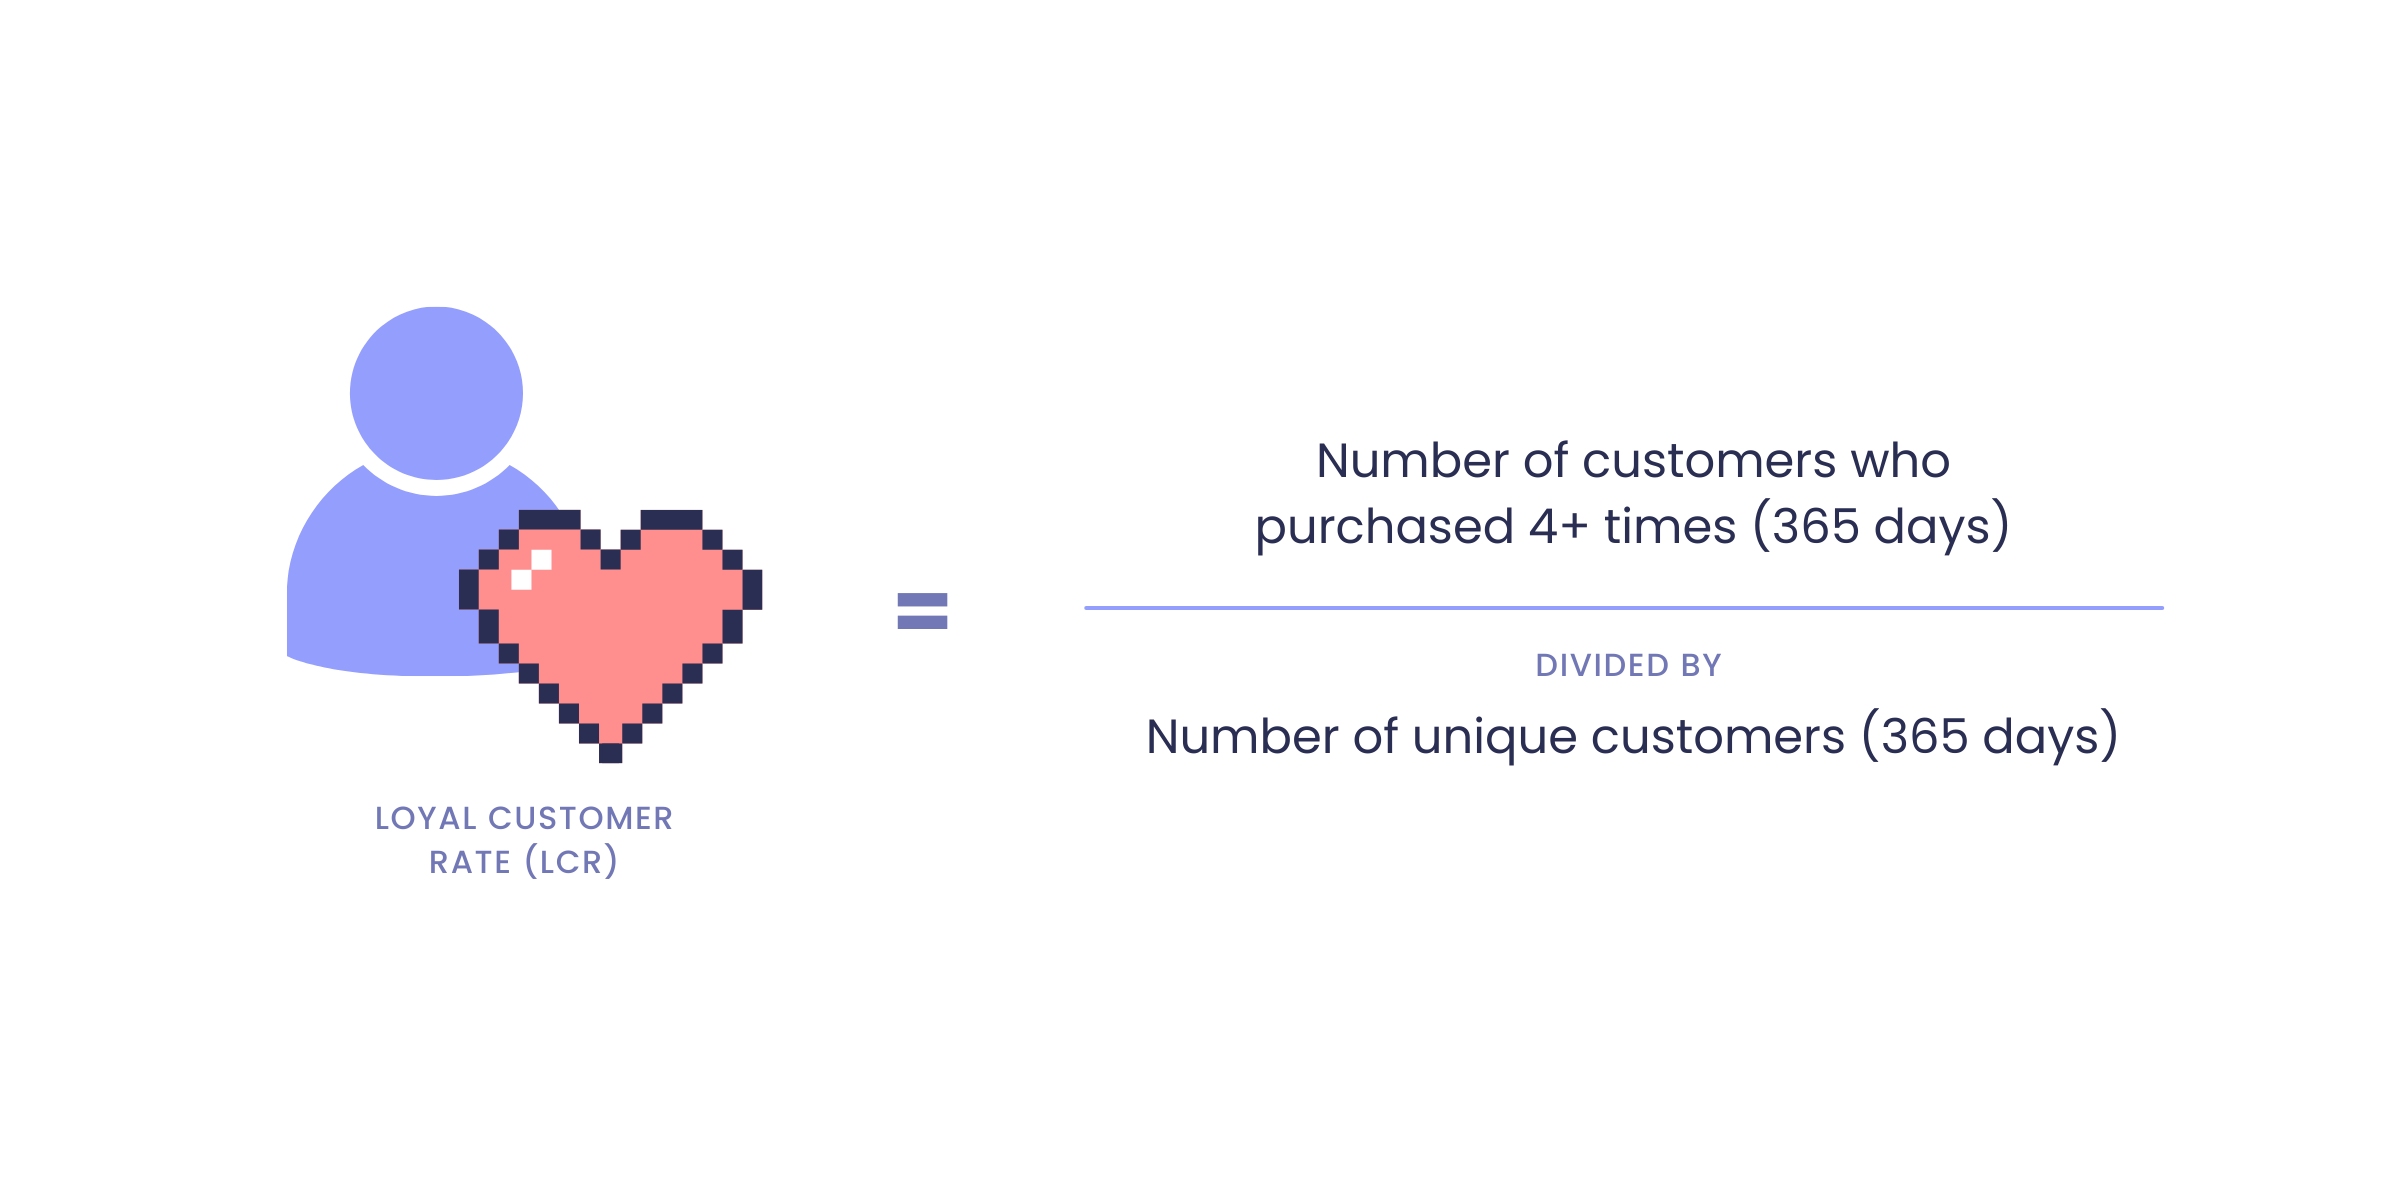
How do you calculate Loyal Customer Rate?
A loyal customer can be defined as someone who makes more than four purchases in your store. Based on that description, you can calculate your store’s loyal customer rate with the following formula:
The Importance of Retention Metrics
When it comes to developing loyal customers, there’s nothing more effective than a loyalty program. Loyalty programs are the proven solution for increasing profitability and securing retention. Implement a strategic loyalty program at the center of your retention strategy to get you on track for more loyal customers and more success for years to come.
Understanding how to track and measure these 11 retention metrics will get you to experience tremendous success with any retention marketing campaign. So whether you’re new to the retention game or an old pro, you’re now prepared to take your industry by storm, securing profitable customers for years and years to come.
Editor’s Note: This post was originally published on January 10, 2017 and was updated for accuracy and comprehensiveness on September 1, 2023.


